European vs Immigrants 4 or more Vehicles in Household

COMPARE

European
Race
Ancestry
AfghanAfricanAlaska NativeAlaskan AthabascanAlbanianAleutAlsatianAmericanApacheArabArapahoArgentineanArmenianAssyrian/Chaldean/SyriacAustralianAustrianBahamianBangladeshiBarbadianBasqueBelgianBelizeanBermudanBhutaneseBlackfeetBolivianBrazilianBritishBritish West IndianBulgarianBurmeseCajunCambodianCanadianCape VerdeanCarpatho RusynCelticCentral AmericanCentral American IndianCherokeeCheyenneChickasawChileanChineseChippewaChoctawColombianColvilleComancheCosta RicanCreeCreekCroatianCrowCubanCypriotCzechCzechoslovakianDanishDelawareDominicanDutchDutch West IndianEastern EuropeanEcuadorianEgyptianEnglishEstonianEthiopianEuropeanFijianFilipinoFinnishFrenchFrench American IndianFrench CanadianGermanGerman RussianGhanaianGreekGuamanian/ChamorroGuatemalanGuyaneseHaitianHmongHonduranHopiHoumaHungarianIcelanderIndian (Asian)IndonesianInupiatIranianIraqiIrishIroquoisIsraeliItalianJamaicanJapaneseJordanianKenyanKiowaKoreanLaotianLatvianLebaneseLiberianLithuanianLumbeeLuxembourgerMacedonianMalaysianMalteseMarshalleseMenomineeMexicanMexican American IndianMongolianMoroccanNative HawaiianNavajoNepaleseNew ZealanderNicaraguanNigerianNorthern EuropeanNorwegianOkinawanOsageOttawaPaiutePakistaniPalestinianPanamanianParaguayanPennsylvania GermanPeruvianPimaPolishPortuguesePotawatomiPuebloPuerto RicanPuget Sound SalishRomanianRussianSalvadoranSamoanScandinavianScotch-IrishScottishSeminoleSenegaleseSerbianShoshoneSierra LeoneanSiouxSlavicSlovakSloveneSomaliSouth AfricanSouth AmericanSouth American IndianSoviet UnionSpaniardSpanishSpanish AmericanSpanish American IndianSri LankanSubsaharan AfricanSudaneseSwedishSwissSyrianTaiwaneseThaiTlingit-HaidaTohono O'OdhamTonganTrinidadian and TobagonianTsimshianTurkishU.S. Virgin IslanderUgandanUkrainianUruguayanUteVenezuelanVietnameseWelshWest IndianYakamaYaquiYugoslavianYumanYup'ikZimbabwean
Immigration
NonimmigrantsAfghanistanAfricaAlbaniaArgentinaArmeniaAsiaAustraliaAustriaBahamasBangladeshBarbadosBelarusBelgiumBelizeBoliviaBosnia and HerzegovinaBrazilBulgariaBurma/MyanmarCabo VerdeCambodiaCameroonCanadaCaribbeanCentral AmericaChileChinaColombiaCongoCosta RicaCroatiaCubaCzechoslovakiaDenmarkDominicaDominican RepublicEastern AfricaEastern AsiaEastern EuropeEcuadorEgyptEl SalvadorEnglandEritreaEthiopiaEuropeFijiFranceGermanyGhanaGreeceGrenadaGuatemalaGuyanaHaitiHondurasHong KongHungaryIndiaIndonesiaIranIraqIrelandIsraelItalyJamaicaJapanJordanKazakhstanKenyaKoreaKuwaitLaosLatin AmericaLatviaLebanonLiberiaLithuaniaMalaysiaMexicoMicronesiaMiddle AfricaMoldovaMoroccoNepalNetherlandsNicaraguaNigeriaNorth AmericaNorth MacedoniaNorthern AfricaNorthern EuropeNorwayOceaniaPakistanPanamaPeruPhilippinesPolandPortugalRomaniaRussiaSaudi ArabiaScotlandSenegalSerbiaSierra LeoneSingaporeSomaliaSouth AfricaSouth AmericaSouth Central AsiaSouth Eastern AsiaSouthern EuropeSpainSri LankaSt. Vincent and the GrenadinesSudanSwedenSwitzerlandSyriaTaiwanThailandTrinidad and TobagoTurkeyUgandaUkraineUruguayUzbekistanVenezuelaVietnamWest IndiesWestern AfricaWestern AsiaWestern EuropeYemenZaireZimbabweAzores
Immigrants
Race
Ancestry
AfghanAfricanAlaska NativeAlaskan AthabascanAlbanianAleutAlsatianAmericanApacheArabArapahoArgentineanArmenianAssyrian/Chaldean/SyriacAustralianAustrianBahamianBangladeshiBarbadianBasqueBelgianBelizeanBermudanBhutaneseBlackfeetBolivianBrazilianBritishBritish West IndianBulgarianBurmeseCajunCambodianCanadianCape VerdeanCarpatho RusynCelticCentral AmericanCentral American IndianCherokeeCheyenneChickasawChileanChineseChippewaChoctawColombianColvilleComancheCosta RicanCreeCreekCroatianCrowCubanCypriotCzechCzechoslovakianDanishDelawareDominicanDutchDutch West IndianEastern EuropeanEcuadorianEgyptianEnglishEstonianEthiopianFijianFilipinoFinnishFrenchFrench American IndianFrench CanadianGermanGerman RussianGhanaianGreekGuamanian/ChamorroGuatemalanGuyaneseHaitianHmongHonduranHopiHoumaHungarianIcelanderIndian (Asian)IndonesianInupiatIranianIraqiIrishIroquoisIsraeliItalianJamaicanJapaneseJordanianKenyanKiowaKoreanLaotianLatvianLebaneseLiberianLithuanianLumbeeLuxembourgerMacedonianMalaysianMalteseMarshalleseMenomineeMexicanMexican American IndianMongolianMoroccanNative HawaiianNavajoNepaleseNew ZealanderNicaraguanNigerianNorthern EuropeanNorwegianOkinawanOsageOttawaPaiutePakistaniPalestinianPanamanianParaguayanPennsylvania GermanPeruvianPimaPolishPortuguesePotawatomiPuebloPuerto RicanPuget Sound SalishRomanianRussianSalvadoranSamoanScandinavianScotch-IrishScottishSeminoleSenegaleseSerbianShoshoneSierra LeoneanSiouxSlavicSlovakSloveneSomaliSouth AfricanSouth AmericanSouth American IndianSoviet UnionSpaniardSpanishSpanish AmericanSpanish American IndianSri LankanSubsaharan AfricanSudaneseSwedishSwissSyrianTaiwaneseThaiTlingit-HaidaTohono O'OdhamTonganTrinidadian and TobagonianTsimshianTurkishU.S. Virgin IslanderUgandanUkrainianUruguayanUteVenezuelanVietnameseWelshWest IndianYakamaYaquiYugoslavianYumanYup'ikZimbabwean
Immigration
NonimmigrantsImmigrantsAfghanistanAfricaAlbaniaArgentinaArmeniaAsiaAustraliaAustriaBahamasBangladeshBarbadosBelarusBelgiumBelizeBoliviaBosnia and HerzegovinaBrazilBulgariaBurma/MyanmarCabo VerdeCambodiaCameroonCanadaCaribbeanCentral AmericaChileChinaColombiaCongoCosta RicaCroatiaCubaCzechoslovakiaDenmarkDominicaDominican RepublicEastern AfricaEastern AsiaEastern EuropeEcuadorEgyptEl SalvadorEnglandEritreaEthiopiaEuropeFijiFranceGermanyGhanaGreeceGrenadaGuatemalaGuyanaHaitiHondurasHong KongHungaryIndiaIndonesiaIranIraqIrelandIsraelItalyJamaicaJapanJordanKazakhstanKenyaKoreaKuwaitLaosLatin AmericaLatviaLebanonLiberiaLithuaniaMalaysiaMexicoMicronesiaMiddle AfricaMoldovaMoroccoNepalNetherlandsNicaraguaNigeriaNorth AmericaNorth MacedoniaNorthern AfricaNorthern EuropeNorwayOceaniaPakistanPanamaPeruPhilippinesPolandPortugalRomaniaRussiaSaudi ArabiaScotlandSenegalSerbiaSierra LeoneSingaporeSomaliaSouth AfricaSouth AmericaSouth Central AsiaSouth Eastern AsiaSouthern EuropeSpainSri LankaSt. Vincent and the GrenadinesSudanSwedenSwitzerlandSyriaTaiwanThailandTrinidad and TobagoTurkeyUgandaUkraineUruguayUzbekistanVenezuelaVietnamWest IndiesWestern AfricaWestern AsiaWestern EuropeYemenZaireZimbabweAzores
4 or more Vehicles in Household
Income
Poverty
Unemployment
Labor Participation
Family Structure
Vehicle Availability
Education Level
Disability

4 or more Vehicles in Household Comparison

Europeans

Immigrants

Exceptional
Exceptional
7.6%
4 OR MORE VEHICLES IN HOUSEHOLD
100.0/ 100
METRIC RATING
61st/ 347
METRIC RANK
6.8%
4 OR MORE VEHICLES IN HOUSEHOLD
94.6/ 100
METRIC RATING
123rd/ 347
METRIC RANK

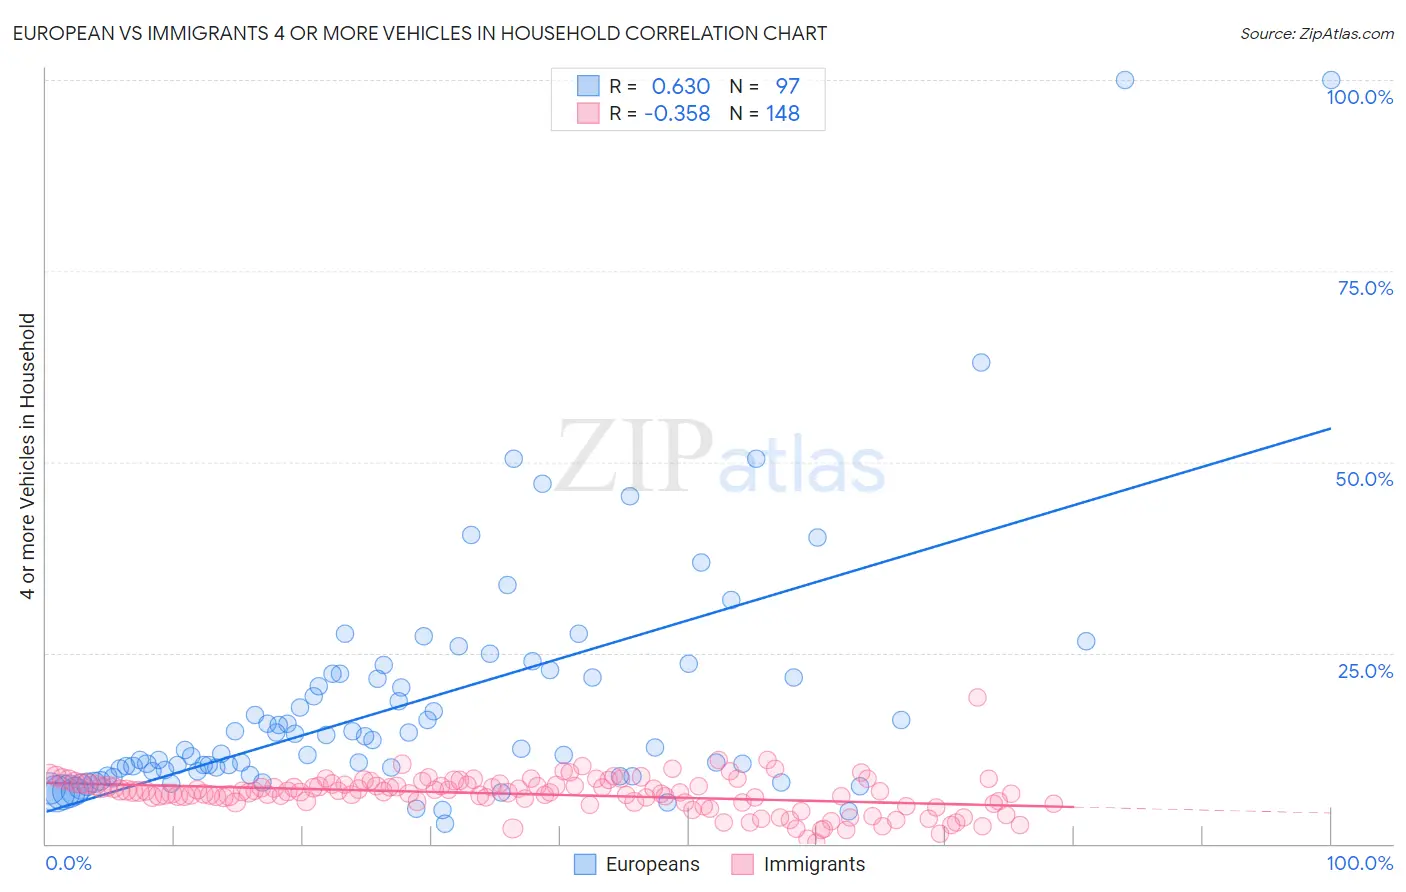
European vs Immigrants 4 or more Vehicles in Household Correlation Chart

The statistical analysis conducted on geographies consisting of 558,591,930 people shows a significant positive correlation between the proportion of Europeans and percentage of households with 4 or more vehicles available in the United States with a correlation coefficient (R) of 0.630 and weighted average of 7.6%. Similarly, the statistical analysis conducted on geographies consisting of 573,807,662 people shows a mild negative correlation between the proportion of Immigrants and percentage of households with 4 or more vehicles available in the United States with a correlation coefficient (R) of -0.358 and weighted average of 6.8%, a difference of 11.9%.
European vs Immigrants 4 or more Vehicles in Household

4 or more Vehicles in Household Correlation Summary

MeasurementEuropeanImmigrants
Minimum2.6%0.13%
Maximum100.0%19.1%
Range97.4%19.0%
Mean18.3%6.5%
Median12.5%6.8%
Interquartile 25% (IQ1)9.2%5.5%
Interquartile 75% (IQ3)22.0%7.8%
Interquartile Range (IQR)12.8%2.3%
Standard Deviation (Sample)16.5%2.4%
Standard Deviation (Population)16.4%2.4%

Similar Demographics by 4 or more Vehicles in Household

Demographics Similar to Europeans by 4 or more Vehicles in Household

In terms of 4 or more vehicles in household, the demographic groups most similar to Europeans are Spaniard (7.6%, a difference of 0.26%), Chippewa (7.6%, a difference of 0.26%), Immigrants from Micronesia (7.6%, a difference of 0.27%), Hispanic or Latino (7.6%, a difference of 0.32%), and Pennsylvania German (7.6%, a difference of 0.36%).
DemographicsRating | Rank4 or more Vehicles in Household
Dutch
100.0
/100
|
#54
Exceptional
7.7%
Immigrants | Oceania
100.0
/100
|
#55
Exceptional
7.6%
English
100.0
/100
|
#56
Exceptional
7.6%
Pennsylvania Germans
100.0
/100
|
#57
Exceptional
7.6%
Swedes
100.0
/100
|
#58
Exceptional
7.6%
Hispanics or Latinos
100.0
/100
|
#59
Exceptional
7.6%
Spaniards
100.0
/100
|
#60
Exceptional
7.6%
Europeans
100.0
/100
|
#61
Exceptional
7.6%
Chippewa
100.0
/100
|
#62
Exceptional
7.6%
Immigrants | Micronesia
100.0
/100
|
#63
Exceptional
7.6%
Bangladeshis
100.0
/100
|
#64
Exceptional
7.6%
Immigrants | Azores
100.0
/100
|
#65
Exceptional
7.5%
Immigrants | Taiwan
99.9
/100
|
#66
Exceptional
7.5%
Americans
99.9
/100
|
#67
Exceptional
7.5%
Welsh
99.9
/100
|
#68
Exceptional
7.5%

Demographics Similar to Immigrants by 4 or more Vehicles in Household

In terms of 4 or more vehicles in household, the demographic groups most similar to Immigrants are Immigrants from Nicaragua (6.8%, a difference of 0.060%), Immigrants from Germany (6.8%, a difference of 0.070%), Immigrants from Asia (6.8%, a difference of 0.10%), Comanche (6.8%, a difference of 0.13%), and Austrian (6.8%, a difference of 0.19%).
DemographicsRating | Rank4 or more Vehicles in Household
Immigrants | Guatemala
95.8
/100
|
#116
Exceptional
6.8%
Burmese
95.7
/100
|
#117
Exceptional
6.8%
French American Indians
95.7
/100
|
#118
Exceptional
6.8%
Costa Ricans
95.5
/100
|
#119
Exceptional
6.8%
Comanche
94.8
/100
|
#120
Exceptional
6.8%
Immigrants | Germany
94.7
/100
|
#121
Exceptional
6.8%
Immigrants | Nicaragua
94.7
/100
|
#122
Exceptional
6.8%
Immigrants | Immigrants
94.6
/100
|
#123
Exceptional
6.8%
Immigrants | Asia
94.4
/100
|
#124
Exceptional
6.8%
Austrians
94.1
/100
|
#125
Exceptional
6.8%
Belgians
94.1
/100
|
#126
Exceptional
6.8%
Immigrants | Korea
93.8
/100
|
#127
Exceptional
6.8%
Immigrants | Bolivia
92.5
/100
|
#128
Exceptional
6.7%
Immigrants | England
92.0
/100
|
#129
Exceptional
6.7%
Immigrants | Scotland
89.0
/100
|
#130
Excellent
6.7%