Cheyenne vs Yugoslavian 4 or more Vehicles in Household
COMPARE
Cheyenne
Yugoslavian
4 or more Vehicles in Household
4 or more Vehicles in Household Comparison
Cheyenne
Yugoslavians
8.3%
4 OR MORE VEHICLES IN HOUSEHOLD
100.0/ 100
METRIC RATING
28th/ 347
METRIC RANK
6.3%
4 OR MORE VEHICLES IN HOUSEHOLD
41.1/ 100
METRIC RATING
181st/ 347
METRIC RANK
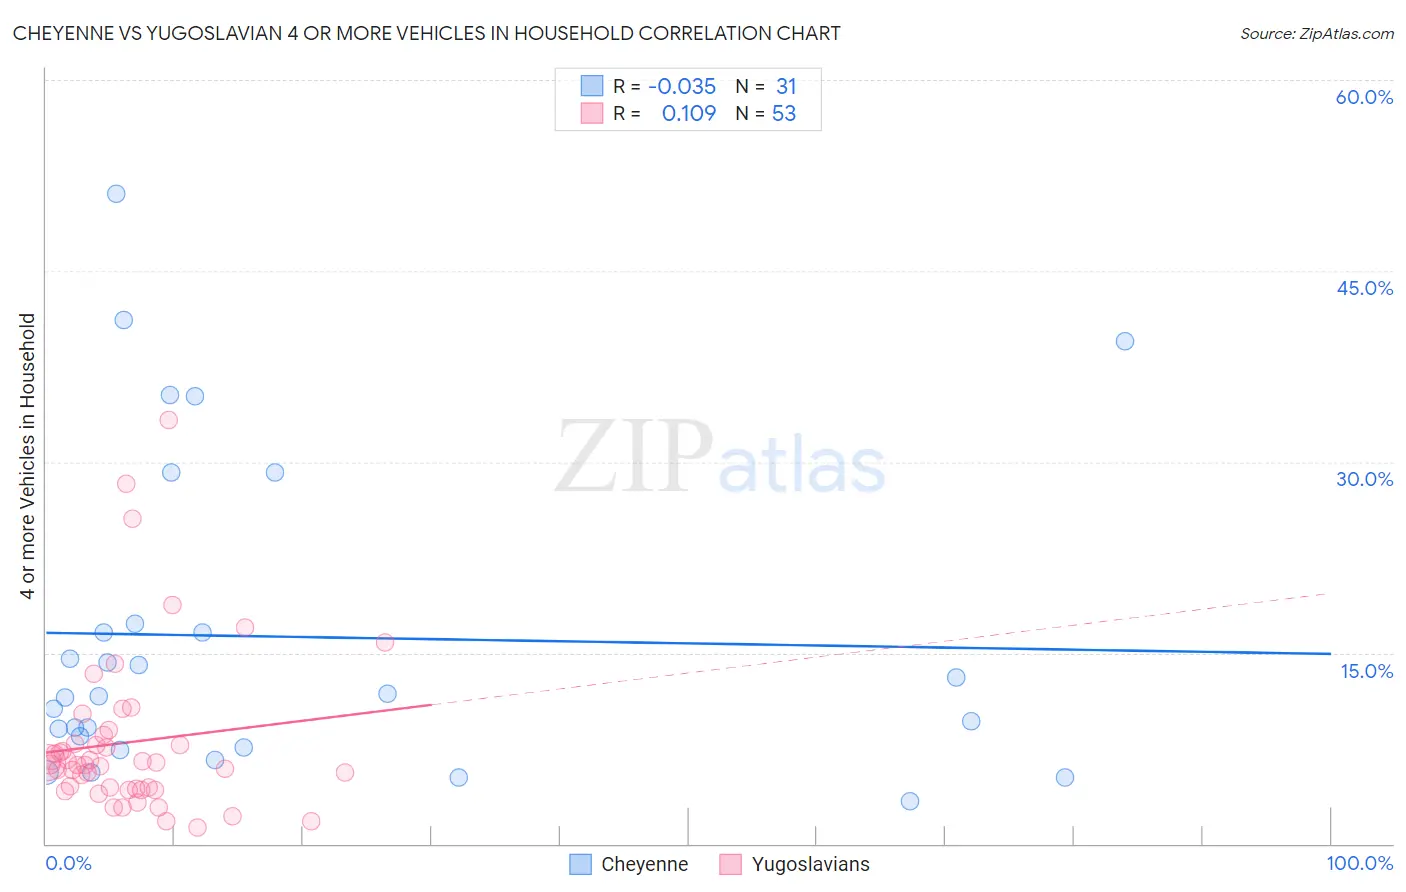
Cheyenne vs Yugoslavian 4 or more Vehicles in Household Correlation Chart
The statistical analysis conducted on geographies consisting of 80,661,568 people shows no correlation between the proportion of Cheyenne and percentage of households with 4 or more vehicles available in the United States with a correlation coefficient (R) of -0.035 and weighted average of 8.3%. Similarly, the statistical analysis conducted on geographies consisting of 285,036,674 people shows a poor positive correlation between the proportion of Yugoslavians and percentage of households with 4 or more vehicles available in the United States with a correlation coefficient (R) of 0.109 and weighted average of 6.3%, a difference of 32.1%.
4 or more Vehicles in Household Correlation Summary
| Measurement | Cheyenne | Yugoslavian |
| Minimum | 3.3% | 1.3% |
| Maximum | 51.1% | 33.3% |
| Range | 47.8% | 32.1% |
| Mean | 16.3% | 8.0% |
| Median | 11.5% | 6.2% |
| Interquartile 25% (IQ1) | 7.5% | 4.3% |
| Interquartile 75% (IQ3) | 17.3% | 8.2% |
| Interquartile Range (IQR) | 9.8% | 3.9% |
| Standard Deviation (Sample) | 12.5% | 6.4% |
| Standard Deviation (Population) | 12.3% | 6.4% |
Similar Demographics by 4 or more Vehicles in Household
Demographics Similar to Cheyenne by 4 or more Vehicles in Household
In terms of 4 or more vehicles in household, the demographic groups most similar to Cheyenne are Immigrants from South Eastern Asia (8.2%, a difference of 0.66%), Navajo (8.2%, a difference of 0.69%), Native/Alaskan (8.2%, a difference of 1.1%), Sri Lankan (8.4%, a difference of 1.4%), and Mexican American Indian (8.4%, a difference of 1.5%).
| Demographics | Rating | Rank | 4 or more Vehicles in Household |
| Danes | 100.0 /100 | #21 | Exceptional 8.6% |
| Immigrants | Vietnam | 100.0 /100 | #22 | Exceptional 8.6% |
| Immigrants | Philippines | 100.0 /100 | #23 | Exceptional 8.5% |
| Immigrants | Central America | 100.0 /100 | #24 | Exceptional 8.5% |
| Basques | 100.0 /100 | #25 | Exceptional 8.4% |
| Mexican American Indians | 100.0 /100 | #26 | Exceptional 8.4% |
| Sri Lankans | 100.0 /100 | #27 | Exceptional 8.4% |
| Cheyenne | 100.0 /100 | #28 | Exceptional 8.3% |
| Immigrants | South Eastern Asia | 100.0 /100 | #29 | Exceptional 8.2% |
| Navajo | 100.0 /100 | #30 | Exceptional 8.2% |
| Natives/Alaskans | 100.0 /100 | #31 | Exceptional 8.2% |
| Marshallese | 100.0 /100 | #32 | Exceptional 8.1% |
| Yaqui | 100.0 /100 | #33 | Exceptional 8.1% |
| Alaskan Athabascans | 100.0 /100 | #34 | Exceptional 8.1% |
| Guamanians/Chamorros | 100.0 /100 | #35 | Exceptional 8.1% |
Demographics Similar to Yugoslavians by 4 or more Vehicles in Household
In terms of 4 or more vehicles in household, the demographic groups most similar to Yugoslavians are South American Indian (6.3%, a difference of 0.050%), Syrian (6.3%, a difference of 0.090%), Immigrants from Japan (6.3%, a difference of 0.20%), Belizean (6.3%, a difference of 0.35%), and Immigrants from Burma/Myanmar (6.2%, a difference of 0.39%).
| Demographics | Rating | Rank | 4 or more Vehicles in Household |
| Lithuanians | 50.0 /100 | #174 | Average 6.3% |
| Immigrants | Western Europe | 48.8 /100 | #175 | Average 6.3% |
| Ukrainians | 47.6 /100 | #176 | Average 6.3% |
| Slovaks | 46.9 /100 | #177 | Average 6.3% |
| Belizeans | 44.5 /100 | #178 | Average 6.3% |
| Immigrants | Japan | 43.1 /100 | #179 | Average 6.3% |
| Syrians | 42.0 /100 | #180 | Average 6.3% |
| Yugoslavians | 41.1 /100 | #181 | Average 6.3% |
| South American Indians | 40.7 /100 | #182 | Average 6.3% |
| Immigrants | Burma/Myanmar | 37.5 /100 | #183 | Fair 6.2% |
| Iraqis | 37.3 /100 | #184 | Fair 6.2% |
| Thais | 36.9 /100 | #185 | Fair 6.2% |
| Immigrants | Northern Europe | 36.8 /100 | #186 | Fair 6.2% |
| Immigrants | South Africa | 35.4 /100 | #187 | Fair 6.2% |
| Kiowa | 34.7 /100 | #188 | Fair 6.2% |