Cheyenne vs Immigrants from Kazakhstan 4 or more Vehicles in Household
COMPARE
Cheyenne
Immigrants from Kazakhstan
4 or more Vehicles in Household
4 or more Vehicles in Household Comparison
Cheyenne
Immigrants from Kazakhstan
8.3%
4 OR MORE VEHICLES IN HOUSEHOLD
100.0/ 100
METRIC RATING
28th/ 347
METRIC RANK
5.5%
4 OR MORE VEHICLES IN HOUSEHOLD
0.6/ 100
METRIC RATING
272nd/ 347
METRIC RANK
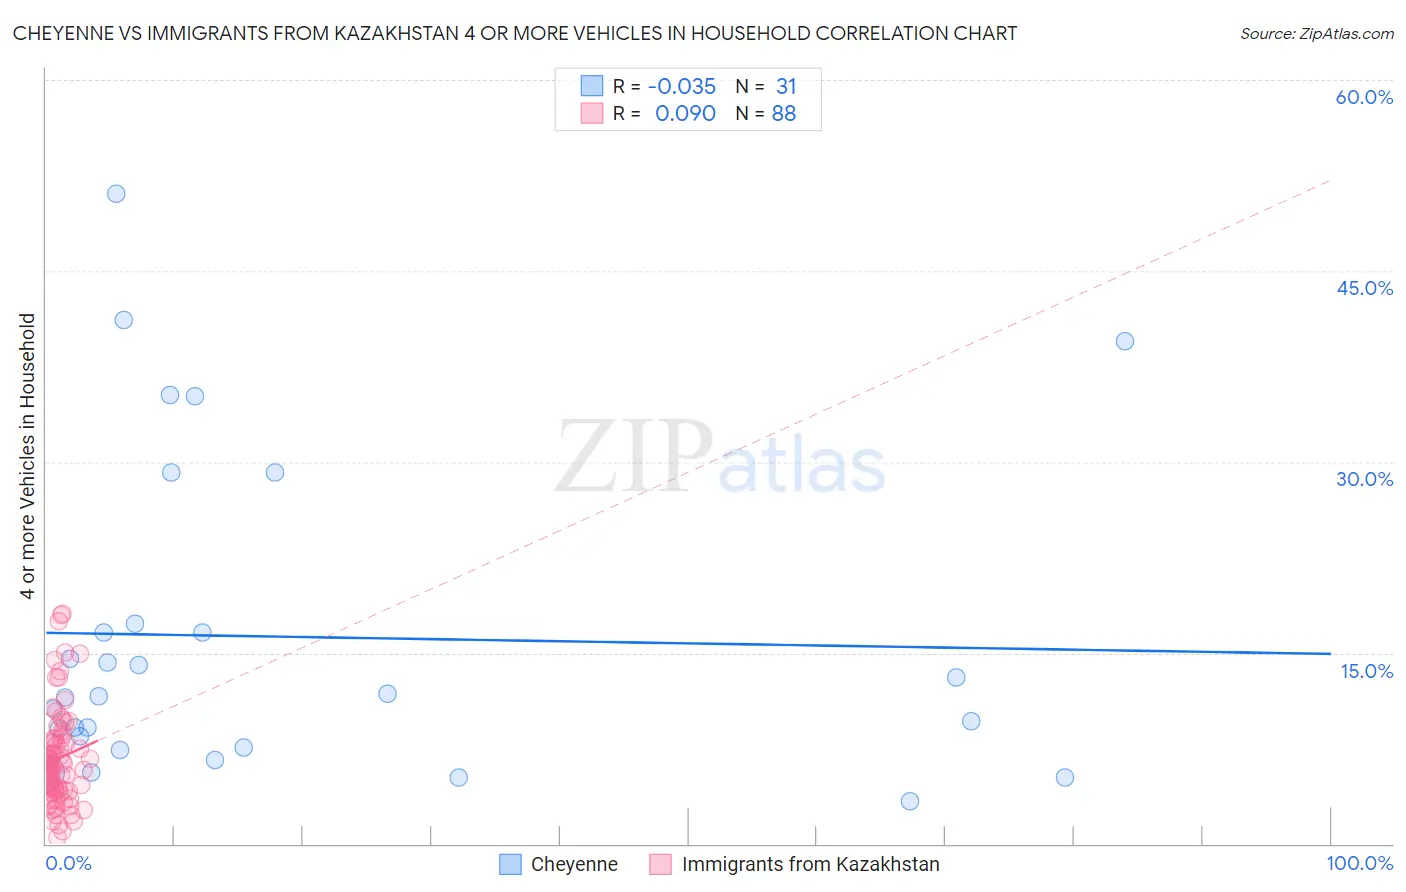
Cheyenne vs Immigrants from Kazakhstan 4 or more Vehicles in Household Correlation Chart
The statistical analysis conducted on geographies consisting of 80,661,568 people shows no correlation between the proportion of Cheyenne and percentage of households with 4 or more vehicles available in the United States with a correlation coefficient (R) of -0.035 and weighted average of 8.3%. Similarly, the statistical analysis conducted on geographies consisting of 124,145,128 people shows a slight positive correlation between the proportion of Immigrants from Kazakhstan and percentage of households with 4 or more vehicles available in the United States with a correlation coefficient (R) of 0.090 and weighted average of 5.5%, a difference of 50.4%.
4 or more Vehicles in Household Correlation Summary
| Measurement | Cheyenne | Immigrants from Kazakhstan |
| Minimum | 3.3% | 0.50% |
| Maximum | 51.1% | 18.0% |
| Range | 47.8% | 17.5% |
| Mean | 16.3% | 6.7% |
| Median | 11.5% | 6.2% |
| Interquartile 25% (IQ1) | 7.5% | 4.3% |
| Interquartile 75% (IQ3) | 17.3% | 8.1% |
| Interquartile Range (IQR) | 9.8% | 3.8% |
| Standard Deviation (Sample) | 12.5% | 3.8% |
| Standard Deviation (Population) | 12.3% | 3.7% |
Similar Demographics by 4 or more Vehicles in Household
Demographics Similar to Cheyenne by 4 or more Vehicles in Household
In terms of 4 or more vehicles in household, the demographic groups most similar to Cheyenne are Immigrants from South Eastern Asia (8.2%, a difference of 0.66%), Navajo (8.2%, a difference of 0.69%), Native/Alaskan (8.2%, a difference of 1.1%), Sri Lankan (8.4%, a difference of 1.4%), and Mexican American Indian (8.4%, a difference of 1.5%).
| Demographics | Rating | Rank | 4 or more Vehicles in Household |
| Danes | 100.0 /100 | #21 | Exceptional 8.6% |
| Immigrants | Vietnam | 100.0 /100 | #22 | Exceptional 8.6% |
| Immigrants | Philippines | 100.0 /100 | #23 | Exceptional 8.5% |
| Immigrants | Central America | 100.0 /100 | #24 | Exceptional 8.5% |
| Basques | 100.0 /100 | #25 | Exceptional 8.4% |
| Mexican American Indians | 100.0 /100 | #26 | Exceptional 8.4% |
| Sri Lankans | 100.0 /100 | #27 | Exceptional 8.4% |
| Cheyenne | 100.0 /100 | #28 | Exceptional 8.3% |
| Immigrants | South Eastern Asia | 100.0 /100 | #29 | Exceptional 8.2% |
| Navajo | 100.0 /100 | #30 | Exceptional 8.2% |
| Natives/Alaskans | 100.0 /100 | #31 | Exceptional 8.2% |
| Marshallese | 100.0 /100 | #32 | Exceptional 8.1% |
| Yaqui | 100.0 /100 | #33 | Exceptional 8.1% |
| Alaskan Athabascans | 100.0 /100 | #34 | Exceptional 8.1% |
| Guamanians/Chamorros | 100.0 /100 | #35 | Exceptional 8.1% |
Demographics Similar to Immigrants from Kazakhstan by 4 or more Vehicles in Household
In terms of 4 or more vehicles in household, the demographic groups most similar to Immigrants from Kazakhstan are Macedonian (5.5%, a difference of 0.030%), Black/African American (5.5%, a difference of 0.15%), Immigrants from Sudan (5.5%, a difference of 0.19%), Cambodian (5.5%, a difference of 0.27%), and Immigrants from Latvia (5.5%, a difference of 0.28%).
| Demographics | Rating | Rank | 4 or more Vehicles in Household |
| South Americans | 0.9 /100 | #265 | Tragic 5.6% |
| Immigrants | Nepal | 0.9 /100 | #266 | Tragic 5.6% |
| Immigrants | Ukraine | 0.9 /100 | #267 | Tragic 5.6% |
| Colombians | 0.7 /100 | #268 | Tragic 5.5% |
| Carpatho Rusyns | 0.7 /100 | #269 | Tragic 5.5% |
| Okinawans | 0.6 /100 | #270 | Tragic 5.5% |
| Immigrants | Sudan | 0.6 /100 | #271 | Tragic 5.5% |
| Immigrants | Kazakhstan | 0.6 /100 | #272 | Tragic 5.5% |
| Macedonians | 0.6 /100 | #273 | Tragic 5.5% |
| Blacks/African Americans | 0.6 /100 | #274 | Tragic 5.5% |
| Cambodians | 0.5 /100 | #275 | Tragic 5.5% |
| Immigrants | Latvia | 0.5 /100 | #276 | Tragic 5.5% |
| Immigrants | Bulgaria | 0.5 /100 | #277 | Tragic 5.5% |
| Immigrants | Eastern Europe | 0.4 /100 | #278 | Tragic 5.4% |
| Immigrants | Uruguay | 0.3 /100 | #279 | Tragic 5.4% |