Cheyenne vs Immigrants from Cuba 4 or more Vehicles in Household
COMPARE
Cheyenne
Immigrants from Cuba
4 or more Vehicles in Household
4 or more Vehicles in Household Comparison
Cheyenne
Immigrants from Cuba
8.3%
4 OR MORE VEHICLES IN HOUSEHOLD
100.0/ 100
METRIC RATING
28th/ 347
METRIC RANK
5.7%
4 OR MORE VEHICLES IN HOUSEHOLD
1.6/ 100
METRIC RATING
253rd/ 347
METRIC RANK
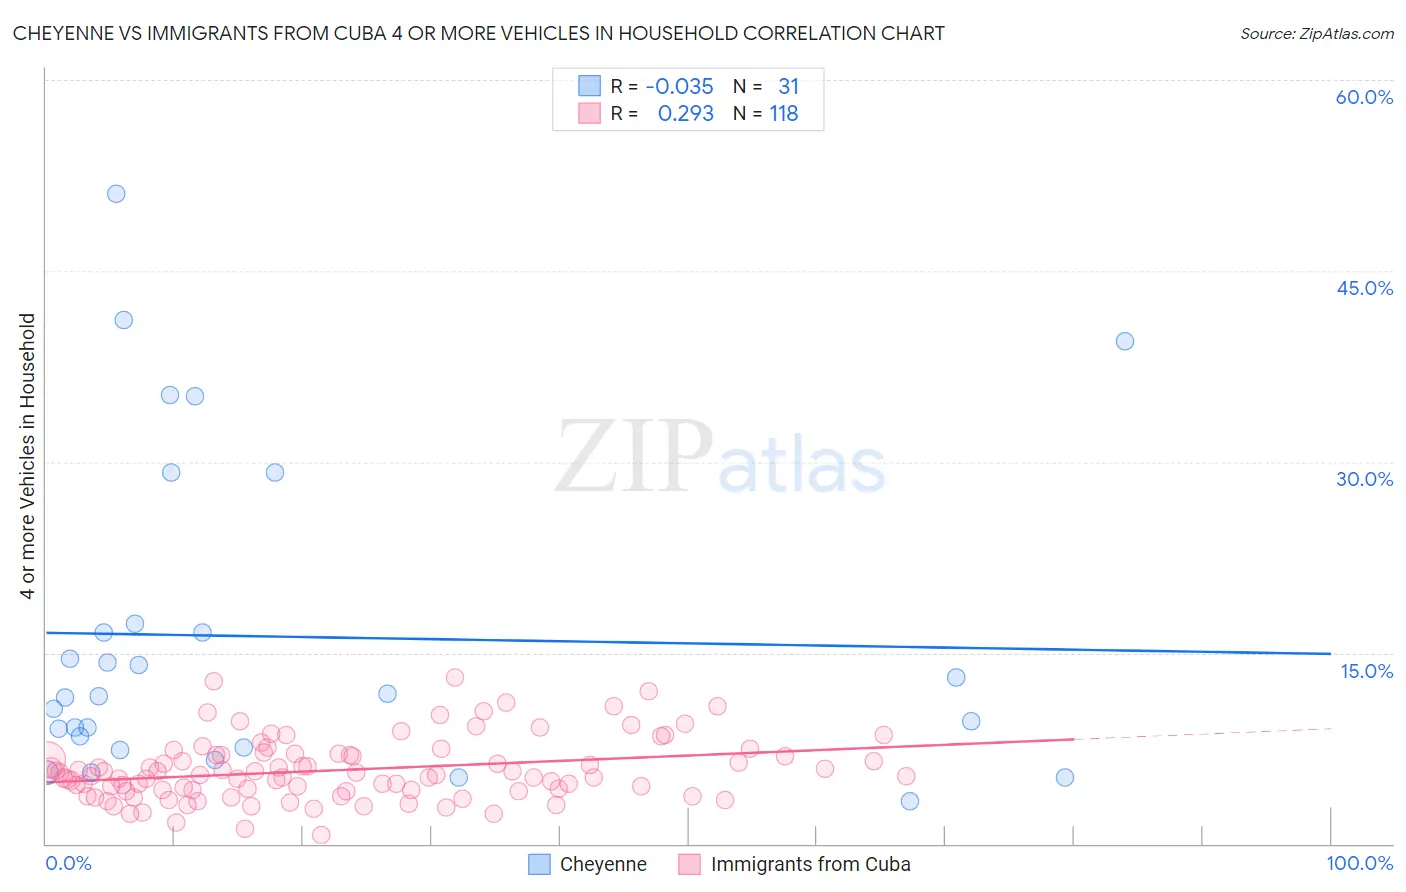
Cheyenne vs Immigrants from Cuba 4 or more Vehicles in Household Correlation Chart
The statistical analysis conducted on geographies consisting of 80,661,568 people shows no correlation between the proportion of Cheyenne and percentage of households with 4 or more vehicles available in the United States with a correlation coefficient (R) of -0.035 and weighted average of 8.3%. Similarly, the statistical analysis conducted on geographies consisting of 324,547,642 people shows a weak positive correlation between the proportion of Immigrants from Cuba and percentage of households with 4 or more vehicles available in the United States with a correlation coefficient (R) of 0.293 and weighted average of 5.7%, a difference of 46.1%.
4 or more Vehicles in Household Correlation Summary
| Measurement | Cheyenne | Immigrants from Cuba |
| Minimum | 3.3% | 0.68% |
| Maximum | 51.1% | 13.0% |
| Range | 47.8% | 12.4% |
| Mean | 16.3% | 5.8% |
| Median | 11.5% | 5.4% |
| Interquartile 25% (IQ1) | 7.5% | 4.2% |
| Interquartile 75% (IQ3) | 17.3% | 7.0% |
| Interquartile Range (IQR) | 9.8% | 2.8% |
| Standard Deviation (Sample) | 12.5% | 2.4% |
| Standard Deviation (Population) | 12.3% | 2.4% |
Similar Demographics by 4 or more Vehicles in Household
Demographics Similar to Cheyenne by 4 or more Vehicles in Household
In terms of 4 or more vehicles in household, the demographic groups most similar to Cheyenne are Immigrants from South Eastern Asia (8.2%, a difference of 0.66%), Navajo (8.2%, a difference of 0.69%), Native/Alaskan (8.2%, a difference of 1.1%), Sri Lankan (8.4%, a difference of 1.4%), and Mexican American Indian (8.4%, a difference of 1.5%).
| Demographics | Rating | Rank | 4 or more Vehicles in Household |
| Danes | 100.0 /100 | #21 | Exceptional 8.6% |
| Immigrants | Vietnam | 100.0 /100 | #22 | Exceptional 8.6% |
| Immigrants | Philippines | 100.0 /100 | #23 | Exceptional 8.5% |
| Immigrants | Central America | 100.0 /100 | #24 | Exceptional 8.5% |
| Basques | 100.0 /100 | #25 | Exceptional 8.4% |
| Mexican American Indians | 100.0 /100 | #26 | Exceptional 8.4% |
| Sri Lankans | 100.0 /100 | #27 | Exceptional 8.4% |
| Cheyenne | 100.0 /100 | #28 | Exceptional 8.3% |
| Immigrants | South Eastern Asia | 100.0 /100 | #29 | Exceptional 8.2% |
| Navajo | 100.0 /100 | #30 | Exceptional 8.2% |
| Natives/Alaskans | 100.0 /100 | #31 | Exceptional 8.2% |
| Marshallese | 100.0 /100 | #32 | Exceptional 8.1% |
| Yaqui | 100.0 /100 | #33 | Exceptional 8.1% |
| Alaskan Athabascans | 100.0 /100 | #34 | Exceptional 8.1% |
| Guamanians/Chamorros | 100.0 /100 | #35 | Exceptional 8.1% |
Demographics Similar to Immigrants from Cuba by 4 or more Vehicles in Household
In terms of 4 or more vehicles in household, the demographic groups most similar to Immigrants from Cuba are Immigrants from Panama (5.7%, a difference of 0.14%), Yup'ik (5.7%, a difference of 0.22%), Immigrants from Turkey (5.7%, a difference of 0.26%), Immigrants from Northern Africa (5.6%, a difference of 0.34%), and Immigrants from Lithuania (5.6%, a difference of 0.48%).
| Demographics | Rating | Rank | 4 or more Vehicles in Household |
| Immigrants | North Macedonia | 2.5 /100 | #246 | Tragic 5.7% |
| Immigrants | Ethiopia | 2.4 /100 | #247 | Tragic 5.7% |
| Immigrants | Eastern Africa | 2.4 /100 | #248 | Tragic 5.7% |
| Immigrants | Southern Europe | 2.3 /100 | #249 | Tragic 5.7% |
| Immigrants | Europe | 2.3 /100 | #250 | Tragic 5.7% |
| Ugandans | 2.2 /100 | #251 | Tragic 5.7% |
| Sub-Saharan Africans | 2.1 /100 | #252 | Tragic 5.7% |
| Immigrants | Cuba | 1.6 /100 | #253 | Tragic 5.7% |
| Immigrants | Panama | 1.5 /100 | #254 | Tragic 5.7% |
| Yup'ik | 1.5 /100 | #255 | Tragic 5.7% |
| Immigrants | Turkey | 1.5 /100 | #256 | Tragic 5.7% |
| Immigrants | Northern Africa | 1.4 /100 | #257 | Tragic 5.6% |
| Immigrants | Lithuania | 1.4 /100 | #258 | Tragic 5.6% |
| Immigrants | France | 1.3 /100 | #259 | Tragic 5.6% |
| Uruguayans | 1.3 /100 | #260 | Tragic 5.6% |