Zip Codes with the Highest Percentage of Federal Government Employees in Wichita Falls, TX

RELATED REPORTS & OPTIONS

Federal Government Employees
Population
Families and Households
Female Fertility
Female Fertility (Unmarried)
Race (Community Size)
Race (Percentage)
Ancestry (Community Size)
AfricanAmericanApacheArabArmenianAssyrian / Chaldean / SyriacAustrianBhutaneseBlackfeetBritishBritish West IndianBurmeseCajunCanadianCentral AmericanCentral American IndianCherokeeChickasawChoctawColombianComancheCreekCroatianCubanCzechCzechoslovakianDanishDominicanDutchDutch West IndianEastern EuropeanEnglishEuropeanFinnishFrenchFrench CanadianGermanGreekGuamanian / ChamorroGuatemalanHonduranHungarianIndian (Asian)IndonesianIrishItalianJamaicanJapaneseKoreanLebaneseLithuanianMexicanMexican American IndianNative HawaiianNavajoNigerianNorthern EuropeanNorwegianPakistaniPeruvianPolishPortuguesePuerto RicanRomanianRussianSalvadoranSamoanScandinavianScotch-IrishScottishSerbianSiouxSlavicSouth AmericanSouth American IndianSpaniardSpanishSri LankanSubsaharan AfricanSwedishSwissThaiUkrainianVenezuelanWelshWest IndianYugoslavian
Ancestry (Percentage)
AfricanAmericanApacheArabArmenianAssyrian / Chaldean / SyriacAustrianBhutaneseBlackfeetBritishBritish West IndianBurmeseCajunCanadianCentral AmericanCentral American IndianCherokeeChickasawChoctawColombianComancheCreekCroatianCubanCzechCzechoslovakianDanishDominicanDutchDutch West IndianEastern EuropeanEnglishEuropeanFinnishFrenchFrench CanadianGermanGreekGuamanian / ChamorroGuatemalanHonduranHungarianIndian (Asian)IndonesianIrishItalianJamaicanJapaneseKoreanLebaneseLithuanianMexicanMexican American IndianNative HawaiianNavajoNigerianNorthern EuropeanNorwegianPakistaniPeruvianPolishPortuguesePuerto RicanRomanianRussianSalvadoranSamoanScandinavianScotch-IrishScottishSerbianSiouxSlavicSouth AmericanSouth American IndianSpaniardSpanishSri LankanSubsaharan AfricanSwedishSwissThaiUkrainianVenezuelanWelshWest IndianYugoslavian
Immigrant Origin (Total)
Immigrant Origin (Percentage)
Income
Income (Families)
Income (Households)
Poverty
Poverty (Families)
Unemployment
Employment Occupations
Employment Industries
Employer Class
Commute Time
Commute Means
School Enrollment
Education by Degree Field
Occupancy
Finances
Physical Characteristics
Wichita Falls
Compare Zip Codes
Comparison Subject

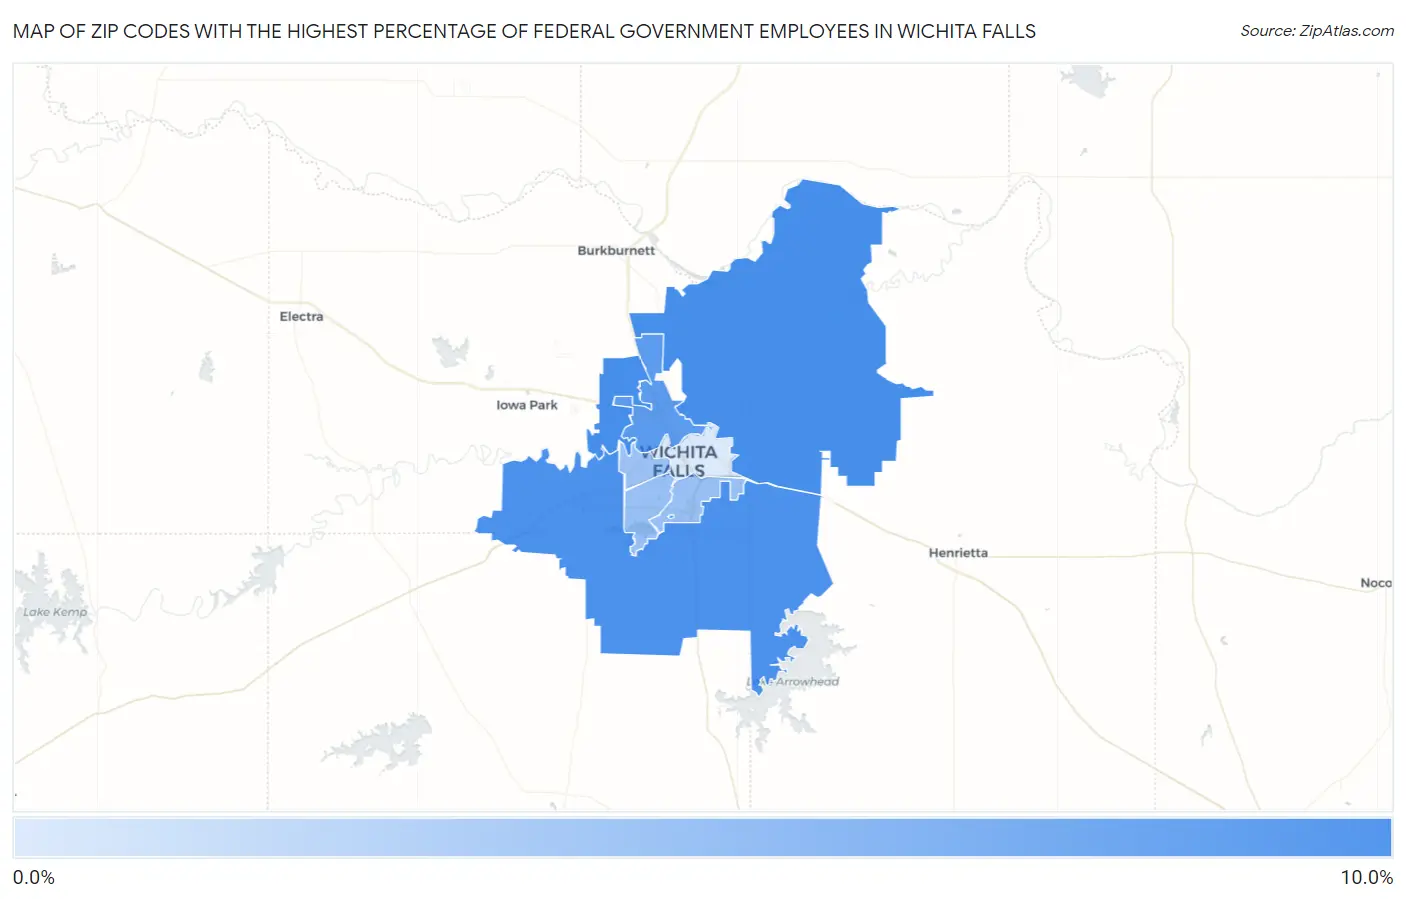
Map of Zip Codes with the Highest Percentage of Federal Government Employees in Wichita Falls

0.0%
10.0%
Zip Codes with the Highest Percentage of Federal Government Employees in Wichita Falls Map

Zip Codes with the Highest Percentage of Federal Government Employees in Wichita Falls, TX

Zip Code % Federal Government Employees vs State vs National
1.763059.2%3.0%(+6.19)#883.4%(+5.83)#2,265
2.763109.0%3.0%(+5.97)#913.4%(+5.61)#2,348
3.763068.2%3.0%(+5.23)#1063.4%(+4.87)#2,644
4.763085.2%3.0%(+2.15)#2183.4%(+1.79)#4,747
5.763025.2%3.0%(+2.14)#2193.4%(+1.78)#4,753
6.763095.0%3.0%(+1.93)#2283.4%(+1.58)#4,982
7.763011.9%3.0%(-1.12)#7833.4%(-1.48)#14,273

Common Questions

What are the Top 5 Zip Codes with the Highest Percentage of Federal Government Employees in Wichita Falls, TX?
Top 5 Zip Codes with the Highest Percentage of Federal Government Employees in Wichita Falls, TX are:
#1
9.2%
#2
9.0%
#3
8.2%
#4
5.2%
#5
5.2%
What zip code has the Highest Percentage of Federal Government Employees in Wichita Falls, TX?
76305 has the Highest Percentage of Federal Government Employees in Wichita Falls, TX with 9.2%.
What is the Percentage of Federal Government Employees in Wichita Falls, TX?
Percentage of Federal Government Employees in Wichita Falls is 14.6%.
What is the Percentage of Federal Government Employees in Texas?
Percentage of Federal Government Employees in Texas is 3.0%.
What is the Percentage of Federal Government Employees in the United States?
Percentage of Federal Government Employees in the United States is 3.4%.