Zip Codes with the Highest Percentage of Population Employed in Agriculture, Fishing & Hunting in Wichita Falls, TX
RELATED REPORTS & OPTIONS
Agriculture, Fishing & Hunting
Wichita Falls
Compare Zip Codes
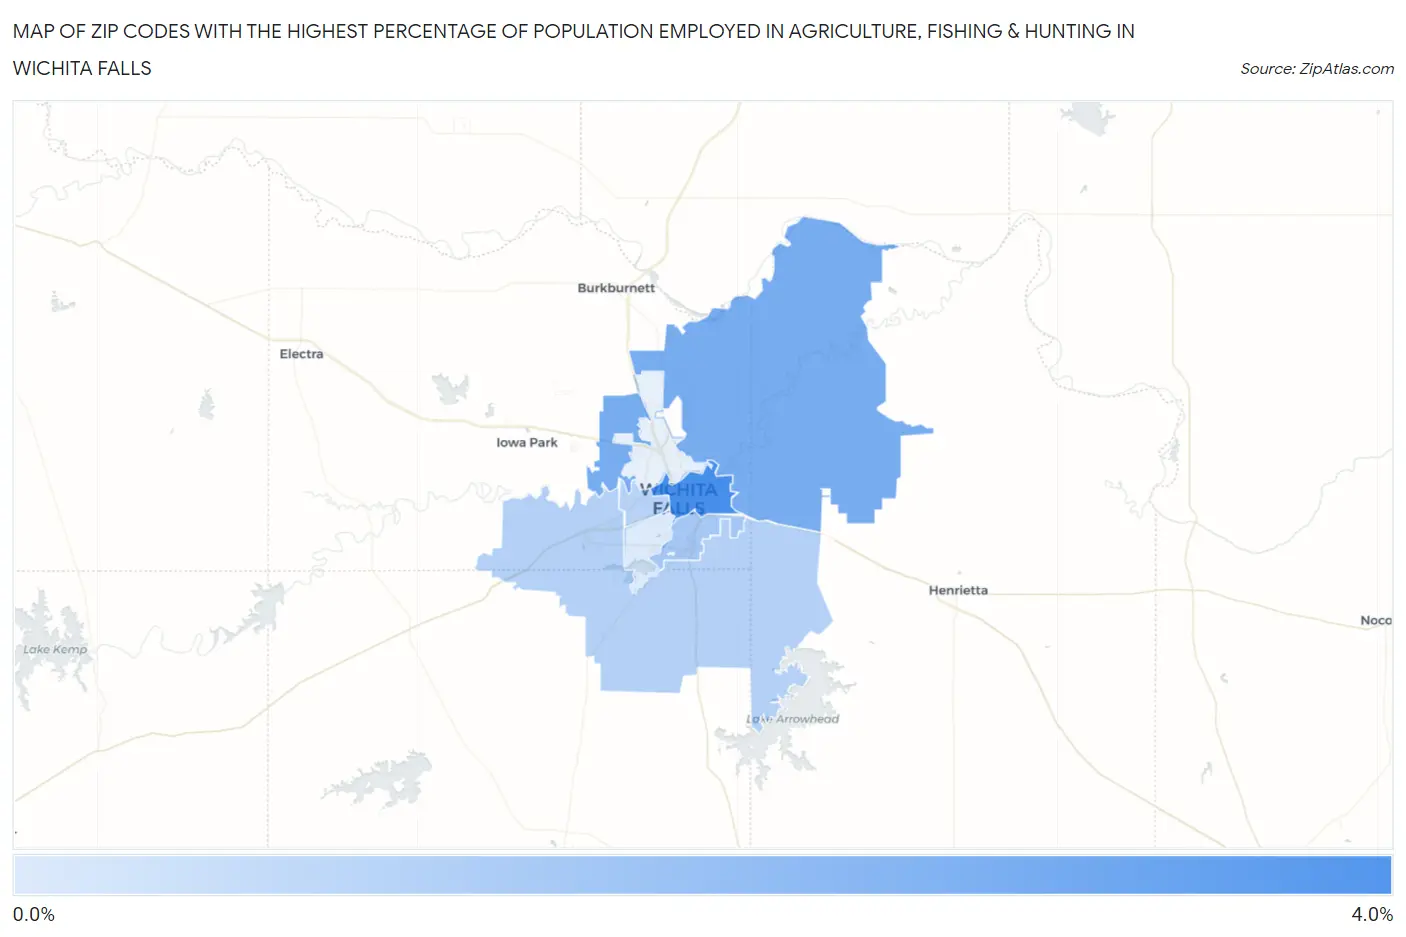
Map of Zip Codes with the Highest Percentage of Population Employed in Agriculture, Fishing & Hunting in Wichita Falls
0.047%
3.2%
Zip Codes with the Highest Percentage of Population Employed in Agriculture, Fishing & Hunting in Wichita Falls, TX
| Zip Code | % Employed | vs State | vs National | |
| 1. | 76301 | 3.2% | 0.75%(+2.42)#538 | 1.2%(+1.97)#10,265 |
| 2. | 76305 | 2.1% | 0.75%(+1.39)#648 | 1.2%(+0.940)#12,403 |
| 3. | 76302 | 1.2% | 0.75%(+0.458)#812 | 1.2%(+0.010)#15,362 |
| 4. | 76310 | 0.91% | 0.75%(+0.156)#875 | 1.2%(-0.292)#16,667 |
| 5. | 76309 | 0.81% | 0.75%(+0.055)#914 | 1.2%(-0.392)#17,202 |
| 6. | 76308 | 0.047% | 0.75%(-0.704)#1,431 | 1.2%(-1.15)#24,374 |
1
Common Questions
What are the Top 5 Zip Codes with the Highest Percentage of Population Employed in Agriculture, Fishing & Hunting in Wichita Falls, TX?
Top 5 Zip Codes with the Highest Percentage of Population Employed in Agriculture, Fishing & Hunting in Wichita Falls, TX are:
What zip code has the Highest Percentage of Population Employed in Agriculture, Fishing & Hunting in Wichita Falls, TX?
76301 has the Highest Percentage of Population Employed in Agriculture, Fishing & Hunting in Wichita Falls, TX with 3.2%.
What is the Percentage of Population Employed in Agriculture, Fishing & Hunting in Wichita Falls, TX?
Percentage of Population Employed in Agriculture, Fishing & Hunting in Wichita Falls is 0.95%.
What is the Percentage of Population Employed in Agriculture, Fishing & Hunting in Texas?
Percentage of Population Employed in Agriculture, Fishing & Hunting in Texas is 0.75%.
What is the Percentage of Population Employed in Agriculture, Fishing & Hunting in the United States?
Percentage of Population Employed in Agriculture, Fishing & Hunting in the United States is 1.2%.