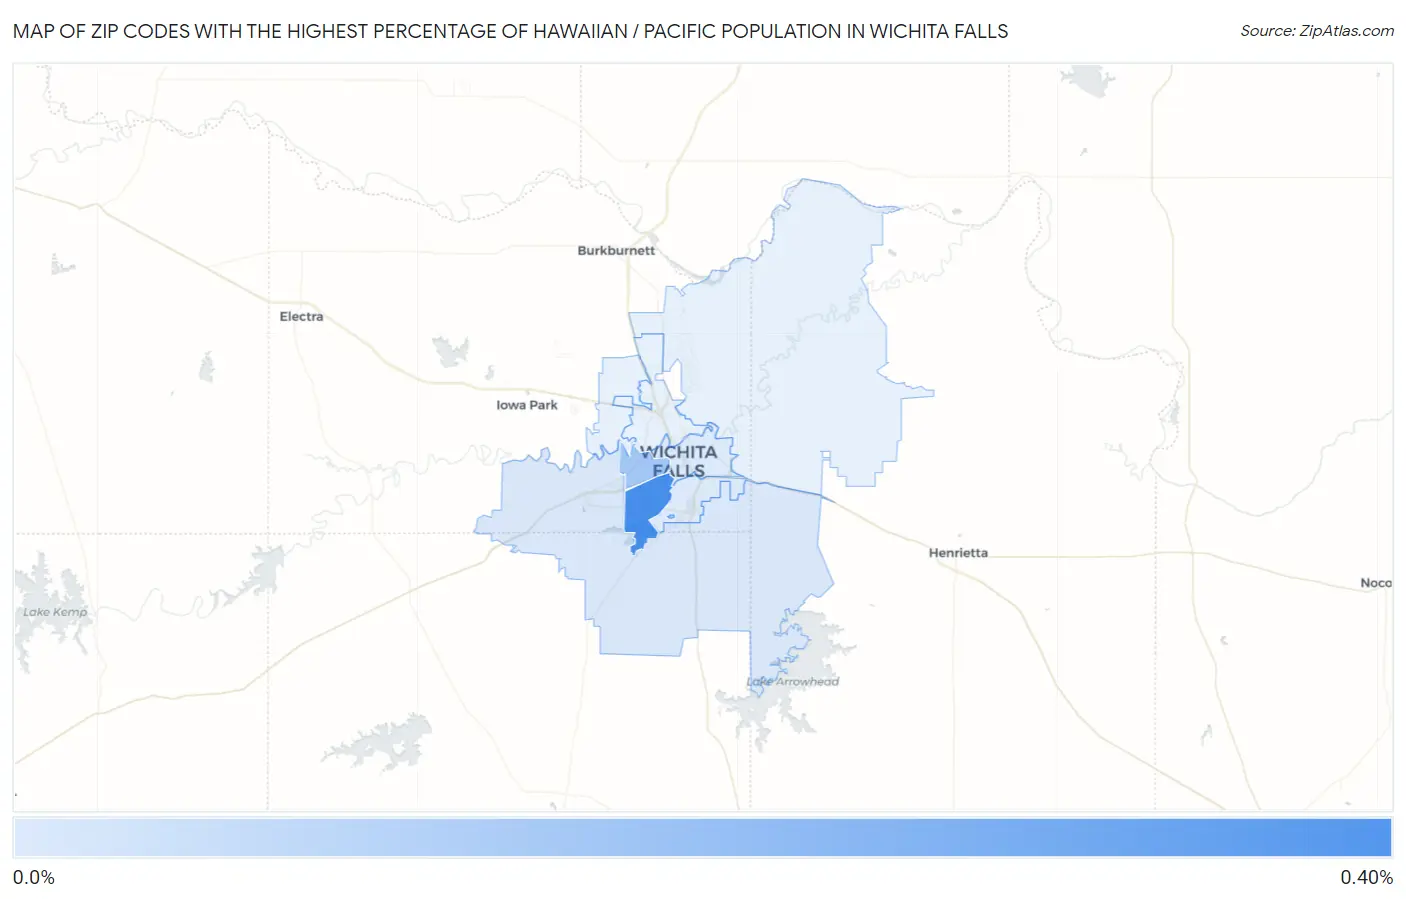
Zip Codes with the Highest Percentage of Hawaiian / Pacific Population in Wichita Falls, TX
RELATED REPORTS & OPTIONS
Hawaiian / Pacific
Wichita Falls
Compare Zip Codes
Map of Zip Codes with the Highest Percentage of Hawaiian / Pacific Population in Wichita Falls
0.070%
0.31%
Zip Codes with the Highest Percentage of Hawaiian / Pacific Population in Wichita Falls, TX
| Zip Code | Hawaiian / Pacific | vs State | vs National | |
| 1. | 76308 | 0.31% | 0.094%(+0.214)#115 | 0.19%(+0.119)#2,078 |
| 2. | 76309 | 0.16% | 0.094%(+0.068)#200 | 0.19%(-0.027)#3,199 |
| 3. | 76310 | 0.076% | 0.094%(-0.017)#297 | 0.19%(-0.112)#4,492 |
| 4. | 76302 | 0.072% | 0.094%(-0.022)#308 | 0.19%(-0.117)#4,597 |
| 5. | 76301 | 0.070% | 0.094%(-0.023)#314 | 0.19%(-0.118)#4,616 |
1
Common Questions
What are the Top 5 Zip Codes with the Highest Percentage of Hawaiian / Pacific Population in Wichita Falls, TX?
Top 5 Zip Codes with the Highest Percentage of Hawaiian / Pacific Population in Wichita Falls, TX are:
What zip code has the Highest Percentage of Hawaiian / Pacific Population in Wichita Falls, TX?
76308 has the Highest Percentage of Hawaiian / Pacific Population in Wichita Falls, TX with 0.31%.
What is the Percentage of Hawaiian / Pacific Population in Wichita Falls, TX?
Percentage of Hawaiian / Pacific Population in Wichita Falls is 0.14%.
What is the Percentage of Hawaiian / Pacific Population in Texas?
Percentage of Hawaiian / Pacific Population in Texas is 0.094%.
What is the Percentage of Hawaiian / Pacific Population in the United States?
Percentage of Hawaiian / Pacific Population in the United States is 0.19%.