Zip Codes with the Highest Percentage of Population Employed in Legal Services & Support in Wichita Falls, TX
RELATED REPORTS & OPTIONS
Legal Services & Support
Wichita Falls
Compare Zip Codes
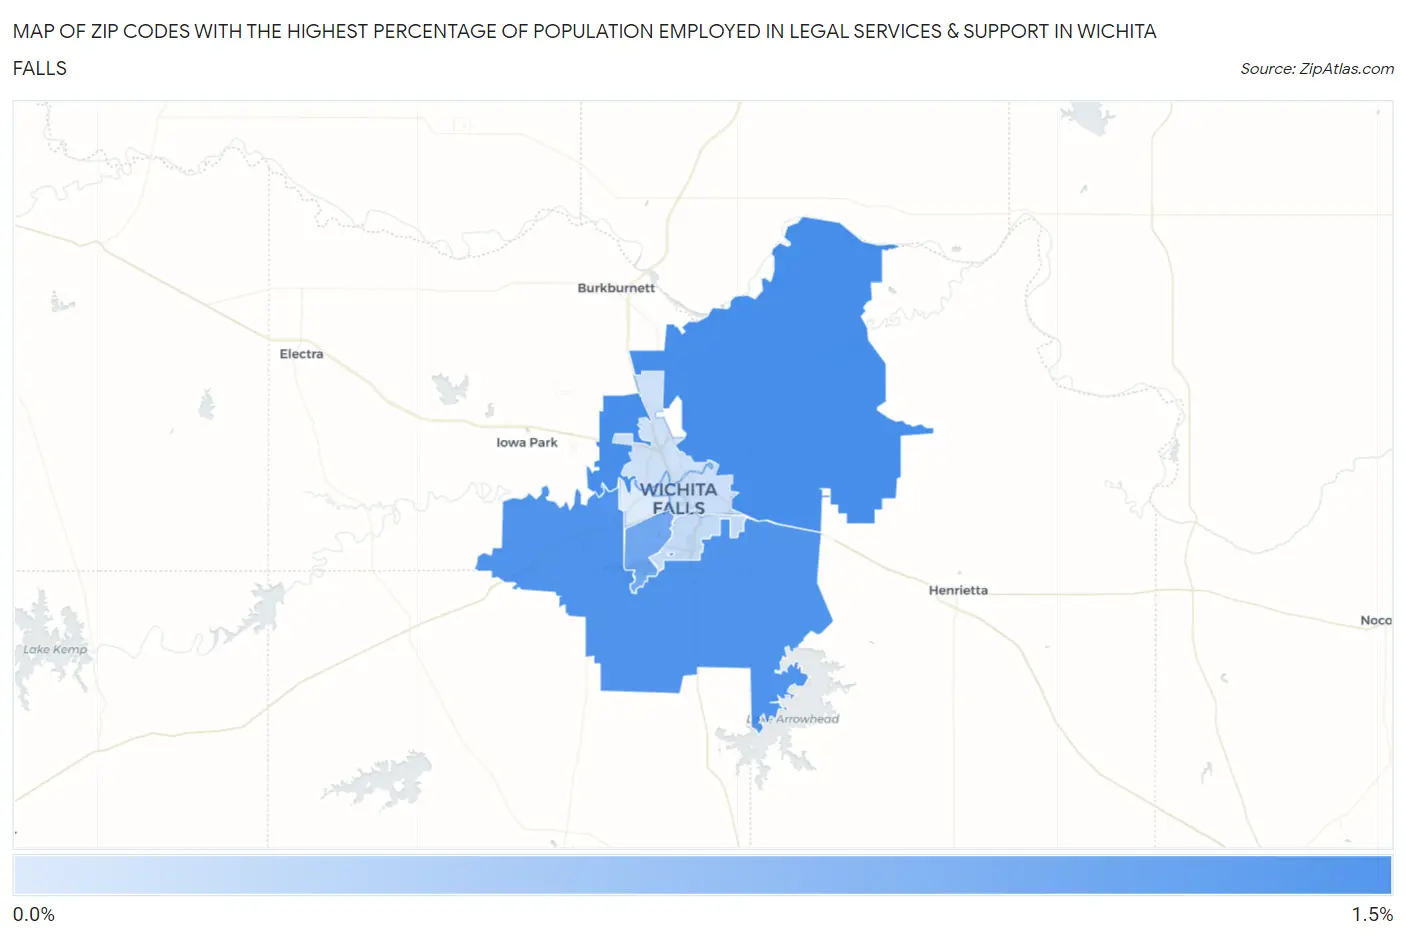
Map of Zip Codes with the Highest Percentage of Population Employed in Legal Services & Support in Wichita Falls
0.16%
1.1%

Zip Codes with the Highest Percentage of Population Employed in Legal Services & Support in Wichita Falls, TX
| Zip Code | % Employed | vs State | vs National | |
| 1. | 76305 | 1.1% | 1.0%(+0.062)#402 | 1.2%(-0.114)#7,366 |
| 2. | 76310 | 1.0% | 1.0%(+0.012)#430 | 1.2%(-0.164)#7,689 |
| 3. | 76308 | 0.81% | 1.0%(-0.195)#518 | 1.2%(-0.371)#9,321 |
| 4. | 76302 | 0.32% | 1.0%(-0.687)#907 | 1.2%(-0.862)#14,795 |
| 5. | 76301 | 0.27% | 1.0%(-0.736)#948 | 1.2%(-0.912)#15,363 |
| 6. | 76306 | 0.25% | 1.0%(-0.760)#965 | 1.2%(-0.936)#15,653 |
| 7. | 76309 | 0.16% | 1.0%(-0.844)#1,022 | 1.2%(-1.02)#16,545 |
1
Common Questions
What are the Top 5 Zip Codes with the Highest Percentage of Population Employed in Legal Services & Support in Wichita Falls, TX?
Top 5 Zip Codes with the Highest Percentage of Population Employed in Legal Services & Support in Wichita Falls, TX are:
What zip code has the Highest Percentage of Population Employed in Legal Services & Support in Wichita Falls, TX?
76305 has the Highest Percentage of Population Employed in Legal Services & Support in Wichita Falls, TX with 1.1%.
What is the Percentage of Population Employed in Legal Services & Support in Wichita Falls, TX?
Percentage of Population Employed in Legal Services & Support in Wichita Falls is 0.52%.
What is the Percentage of Population Employed in Legal Services & Support in Texas?
Percentage of Population Employed in Legal Services & Support in Texas is 1.0%.
What is the Percentage of Population Employed in Legal Services & Support in the United States?
Percentage of Population Employed in Legal Services & Support in the United States is 1.2%.