Zip Codes with the Highest Percentage of Population Employed in Health Diagnosing & Treating in Wichita Falls, TX
RELATED REPORTS & OPTIONS
Health Diagnosing & Treating
Wichita Falls
Compare Zip Codes
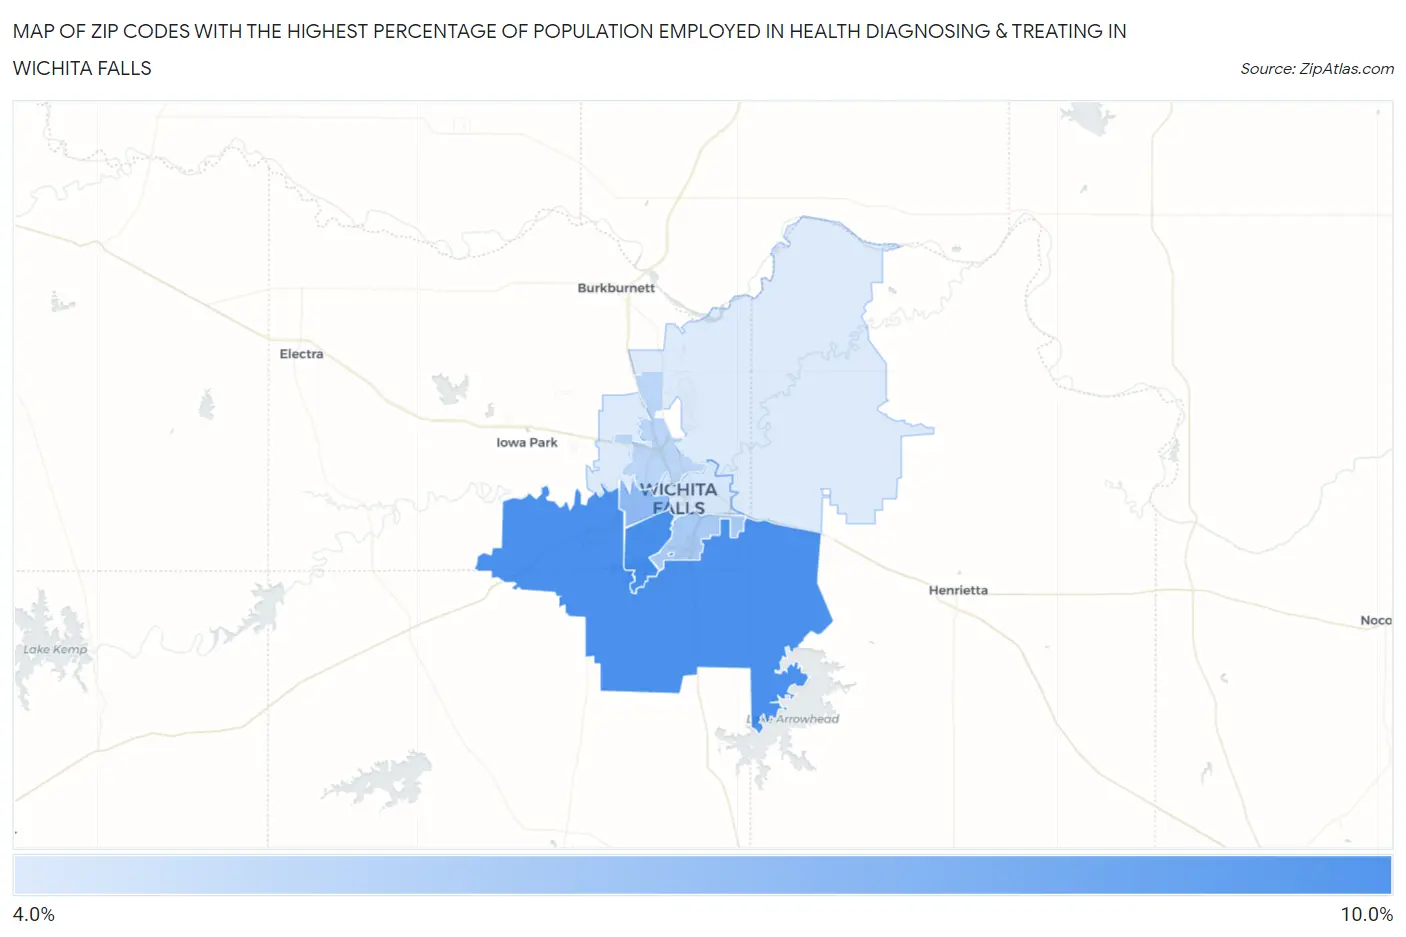
Map of Zip Codes with the Highest Percentage of Population Employed in Health Diagnosing & Treating in Wichita Falls
4.4%
8.3%
Zip Codes with the Highest Percentage of Population Employed in Health Diagnosing & Treating in Wichita Falls, TX
| Zip Code | % Employed | vs State | vs National | |
| 1. | 76308 | 8.3% | 5.5%(+2.73)#283 | 6.2%(+2.01)#6,884 |
| 2. | 76310 | 8.2% | 5.5%(+2.68)#288 | 6.2%(+1.95)#7,011 |
| 3. | 76309 | 6.4% | 5.5%(+0.892)#518 | 6.2%(+0.166)#12,331 |
| 4. | 76302 | 5.7% | 5.5%(+0.228)#646 | 6.2%(-0.498)#14,812 |
| 5. | 76306 | 5.2% | 5.5%(-0.289)#773 | 6.2%(-1.02)#16,824 |
| 6. | 76301 | 4.5% | 5.5%(-0.986)#944 | 6.2%(-1.71)#19,519 |
| 7. | 76305 | 4.4% | 5.5%(-1.15)#973 | 6.2%(-1.87)#20,086 |
1
Common Questions
What are the Top 5 Zip Codes with the Highest Percentage of Population Employed in Health Diagnosing & Treating in Wichita Falls, TX?
Top 5 Zip Codes with the Highest Percentage of Population Employed in Health Diagnosing & Treating in Wichita Falls, TX are:
What zip code has the Highest Percentage of Population Employed in Health Diagnosing & Treating in Wichita Falls, TX?
76308 has the Highest Percentage of Population Employed in Health Diagnosing & Treating in Wichita Falls, TX with 8.3%.
What is the Percentage of Population Employed in Health Diagnosing & Treating in Wichita Falls, TX?
Percentage of Population Employed in Health Diagnosing & Treating in Wichita Falls is 6.3%.
What is the Percentage of Population Employed in Health Diagnosing & Treating in Texas?
Percentage of Population Employed in Health Diagnosing & Treating in Texas is 5.5%.
What is the Percentage of Population Employed in Health Diagnosing & Treating in the United States?
Percentage of Population Employed in Health Diagnosing & Treating in the United States is 6.2%.