Zip Codes with the Highest Percentage of Population Taking Taxi / Cab to Work in North Richland Hills, TX
RELATED REPORTS & OPTIONS
Taxi / Cab
North Richland Hills
Compare Zip Codes
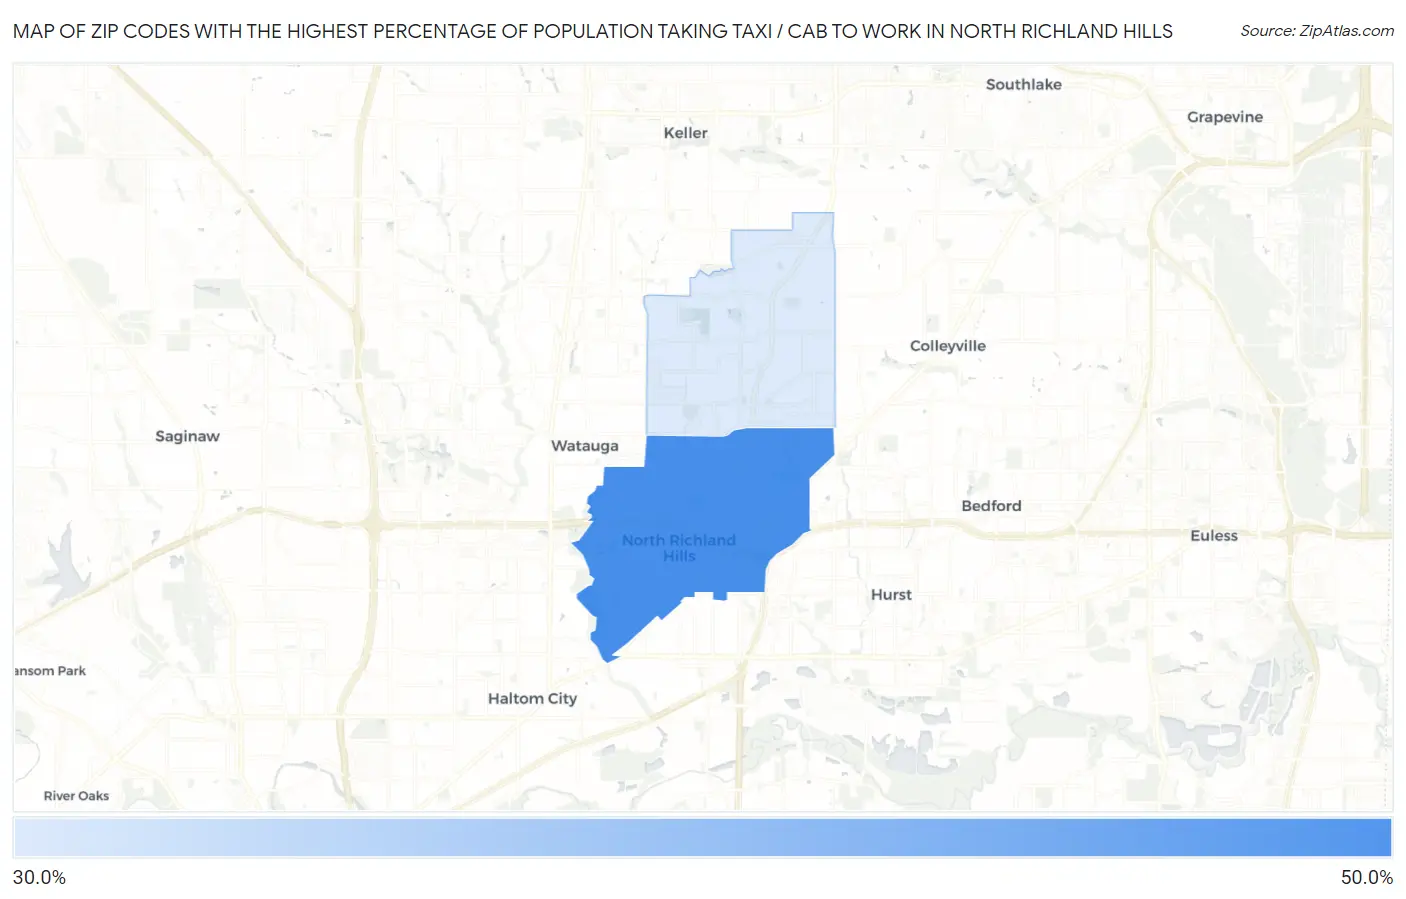
Map of Zip Codes with the Highest Percentage of Population Taking Taxi / Cab to Work in North Richland Hills
33.1%
41.1%
Zip Codes with the Highest Percentage of Population Taking Taxi / Cab to Work in North Richland Hills, TX
| Zip Code | % Take Taxi / Cab | vs State | vs National | |
| 1. | 76180 | 41.1% | 36.9%(+4.20)#371 | 38.2%(+2.90)#6,105 |
| 2. | 76182 | 33.1% | 36.9%(-3.80)#613 | 38.2%(-5.10)#9,723 |
1
Common Questions
What are the Top Zip Codes with the Highest Percentage of Population Taking Taxi / Cab to Work in North Richland Hills, TX?
Top Zip Codes with the Highest Percentage of Population Taking Taxi / Cab to Work in North Richland Hills, TX are:
What zip code has the Highest Percentage of Population Taking Taxi / Cab to Work in North Richland Hills, TX?
76180 has the Highest Percentage of Population Taking Taxi / Cab to Work in North Richland Hills, TX with 41.1%.
What is the Percentage of Population Taking Taxi / Cab to Work in North Richland Hills, TX?
Percentage of Population Taking Taxi / Cab to Work in North Richland Hills is 28.8%.
What is the Percentage of Population Taking Taxi / Cab to Work in Texas?
Percentage of Population Taking Taxi / Cab to Work in Texas is 36.9%.
What is the Percentage of Population Taking Taxi / Cab to Work in the United States?
Percentage of Population Taking Taxi / Cab to Work in the United States is 38.2%.