Zip Codes with the Highest Percentage of Hawaiian / Pacific Population in North Richland Hills, TX
RELATED REPORTS & OPTIONS
Hawaiian / Pacific
North Richland Hills
Compare Zip Codes
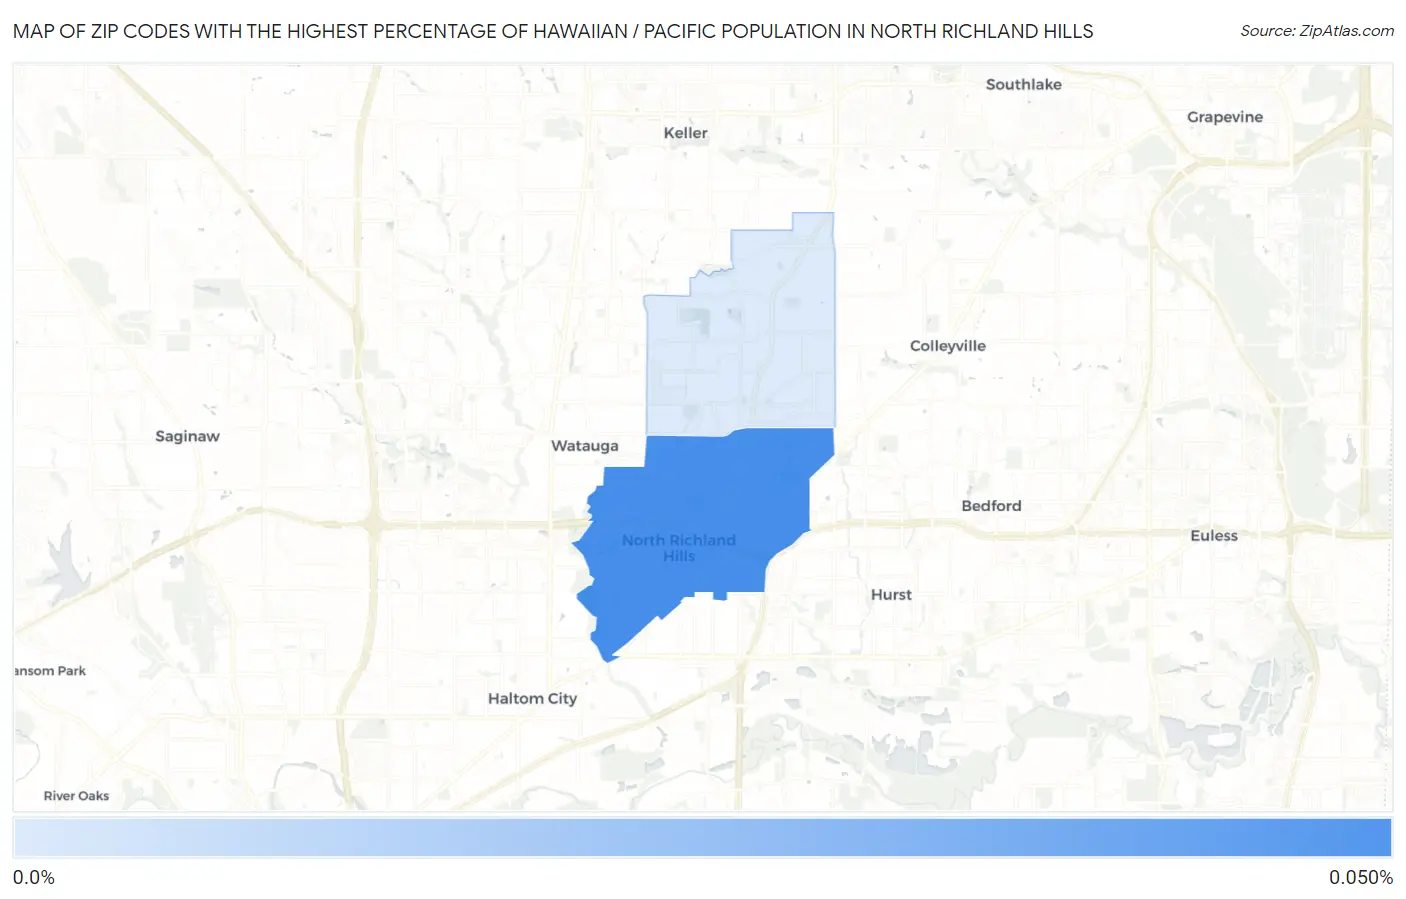
Map of Zip Codes with the Highest Percentage of Hawaiian / Pacific Population in North Richland Hills
0.0033%
0.046%
Zip Codes with the Highest Percentage of Hawaiian / Pacific Population in North Richland Hills, TX
| Zip Code | Hawaiian / Pacific | vs State | vs National | |
| 1. | 76180 | 0.046% | 0.094%(-0.048)#363 | 0.19%(-0.143)#5,199 |
| 2. | 76182 | 0.0033% | 0.094%(-0.090)#473 | 0.19%(-0.185)#6,432 |
1
Common Questions
What are the Top Zip Codes with the Highest Percentage of Hawaiian / Pacific Population in North Richland Hills, TX?
Top Zip Codes with the Highest Percentage of Hawaiian / Pacific Population in North Richland Hills, TX are:
What zip code has the Highest Percentage of Hawaiian / Pacific Population in North Richland Hills, TX?
76180 has the Highest Percentage of Hawaiian / Pacific Population in North Richland Hills, TX with 0.046%.
What is the Percentage of Hawaiian / Pacific Population in North Richland Hills, TX?
Percentage of Hawaiian / Pacific Population in North Richland Hills is 0.026%.
What is the Percentage of Hawaiian / Pacific Population in Texas?
Percentage of Hawaiian / Pacific Population in Texas is 0.094%.
What is the Percentage of Hawaiian / Pacific Population in the United States?
Percentage of Hawaiian / Pacific Population in the United States is 0.19%.