Zip Codes with the Highest Percentage of Population with a Degree in Visual and Performing Arts in North Richland Hills, TX
RELATED REPORTS & OPTIONS
Visual and Performing Arts
North Richland Hills
Compare Zip Codes
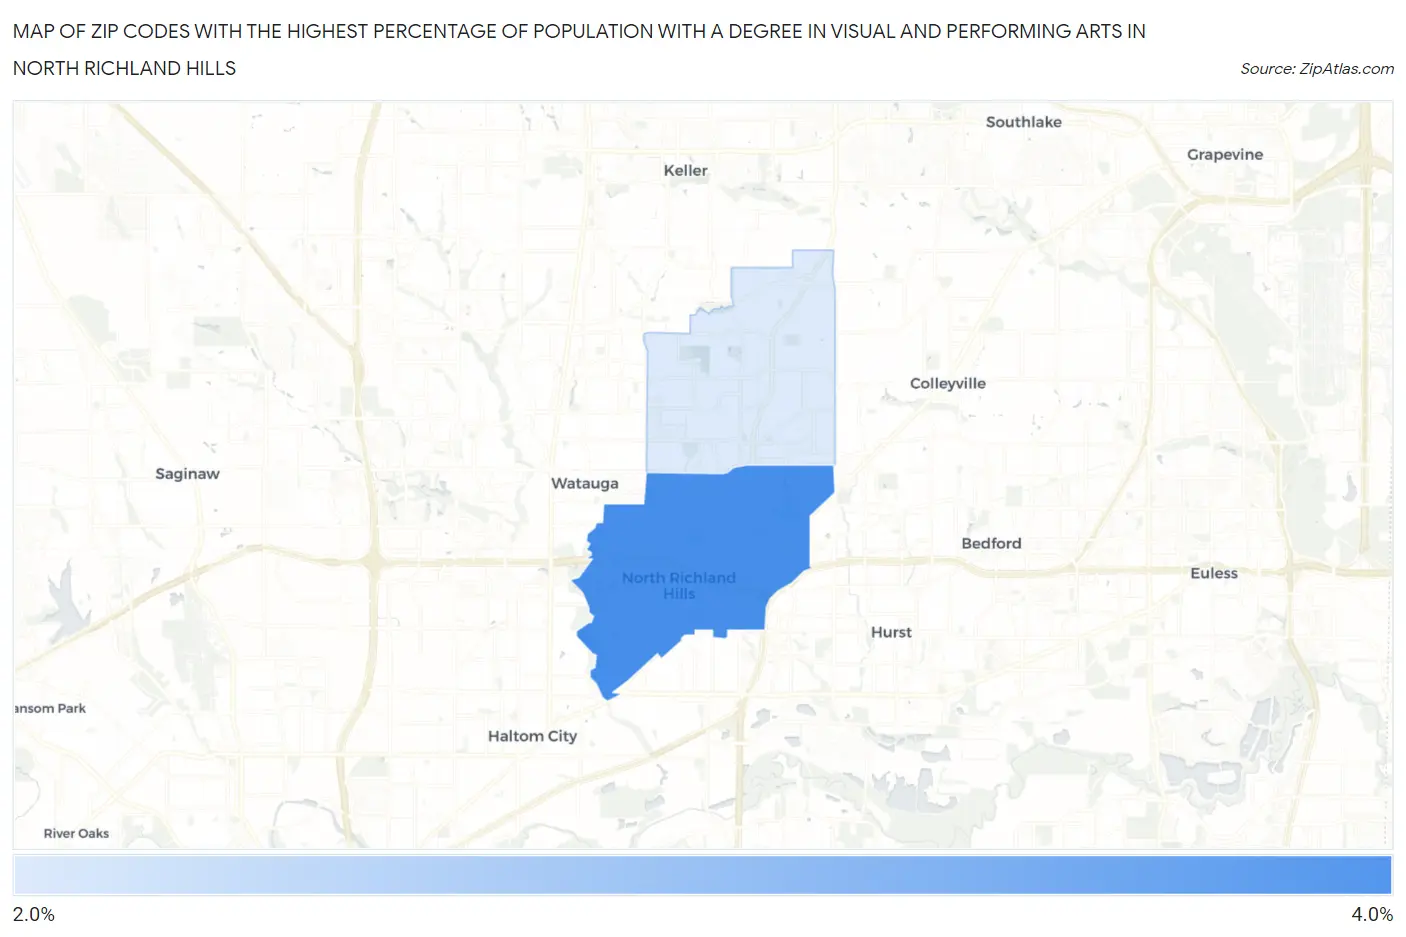
Map of Zip Codes with the Highest Percentage of Population with a Degree in Visual and Performing Arts in North Richland Hills
2.7%
3.4%
Zip Codes with the Highest Percentage of Population with a Degree in Visual and Performing Arts in North Richland Hills, TX
| Zip Code | % Graduates | vs State | vs National | |
| 1. | 76180 | 3.4% | 3.2%(+0.237)#502 | 4.3%(-0.806)#11,106 |
| 2. | 76182 | 2.7% | 3.2%(-0.492)#671 | 4.3%(-1.54)#13,831 |
1
Common Questions
What are the Top Zip Codes with the Highest Percentage of Population with a Degree in Visual and Performing Arts in North Richland Hills, TX?
Top Zip Codes with the Highest Percentage of Population with a Degree in Visual and Performing Arts in North Richland Hills, TX are:
What zip code has the Highest Percentage of Population with a Degree in Visual and Performing Arts in North Richland Hills, TX?
76180 has the Highest Percentage of Population with a Degree in Visual and Performing Arts in North Richland Hills, TX with 3.4%.
What is the Percentage of Population with a Degree in Visual and Performing Arts in North Richland Hills, TX?
Percentage of Population with a Degree in Visual and Performing Arts in North Richland Hills is 3.1%.
What is the Percentage of Population with a Degree in Visual and Performing Arts in Texas?
Percentage of Population with a Degree in Visual and Performing Arts in Texas is 3.2%.
What is the Percentage of Population with a Degree in Visual and Performing Arts in the United States?
Percentage of Population with a Degree in Visual and Performing Arts in the United States is 4.3%.