Zip Codes with the Highest Percentage of Population Employed in Mining, Quarrying, & Extraction in North Richland Hills, TX
RELATED REPORTS & OPTIONS
Mining, Quarrying, & Extraction
North Richland Hills
Compare Zip Codes
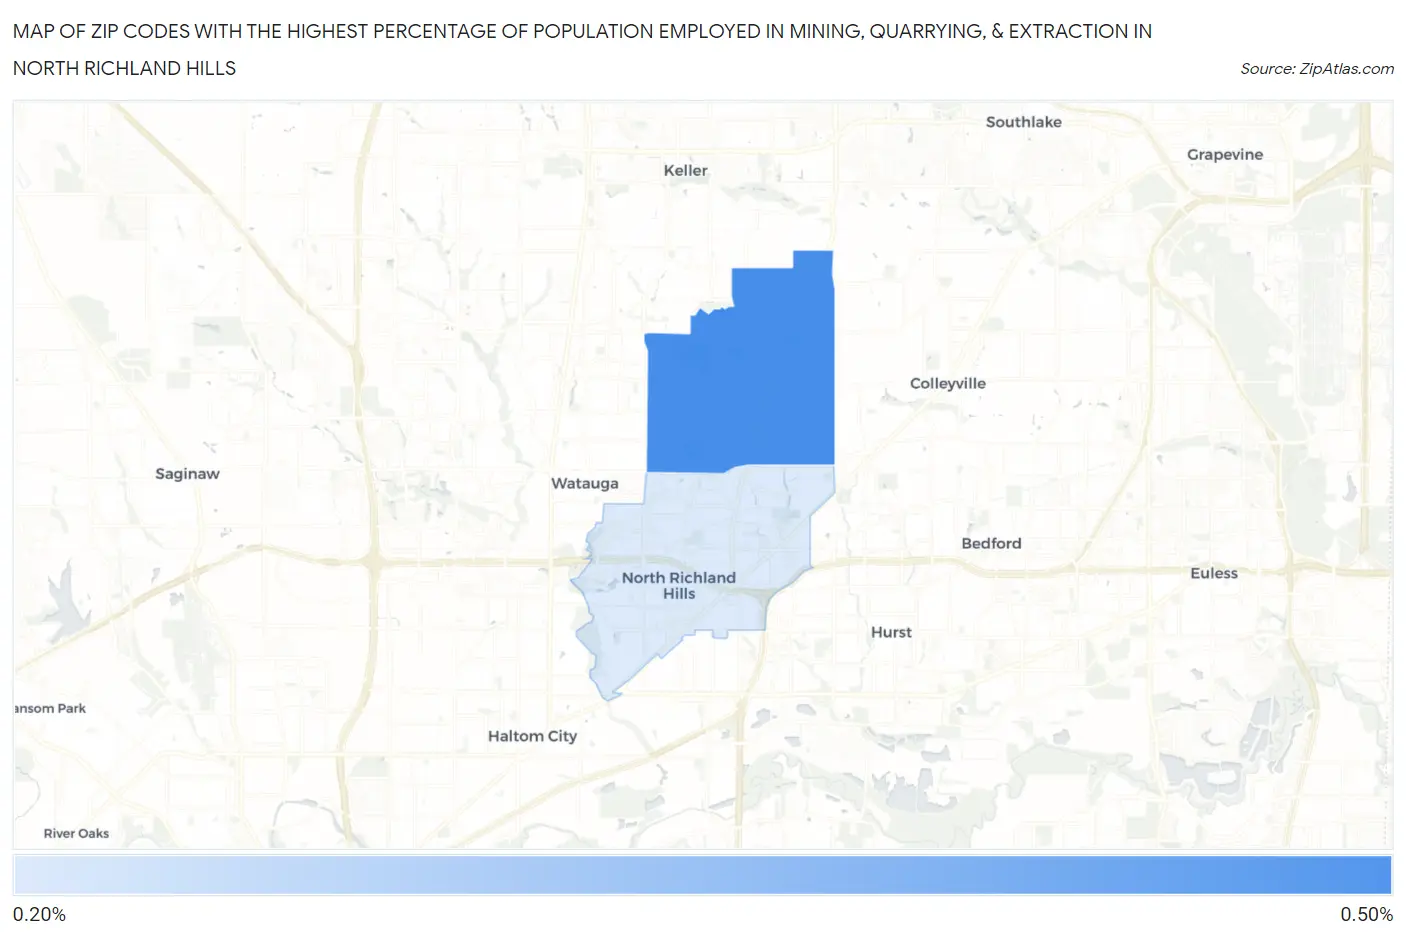
Map of Zip Codes with the Highest Percentage of Population Employed in Mining, Quarrying, & Extraction in North Richland Hills
0.23%
0.49%
Zip Codes with the Highest Percentage of Population Employed in Mining, Quarrying, & Extraction in North Richland Hills, TX
| Zip Code | % Employed | vs State | vs National | |
| 1. | 76182 | 0.49% | 1.9%(-1.37)#1,221 | 0.44%(+0.045)#7,264 |
| 2. | 76180 | 0.23% | 1.9%(-1.63)#1,392 | 0.44%(-0.213)#9,207 |
1
Common Questions
What are the Top Zip Codes with the Highest Percentage of Population Employed in Mining, Quarrying, & Extraction in North Richland Hills, TX?
Top Zip Codes with the Highest Percentage of Population Employed in Mining, Quarrying, & Extraction in North Richland Hills, TX are:
What zip code has the Highest Percentage of Population Employed in Mining, Quarrying, & Extraction in North Richland Hills, TX?
76182 has the Highest Percentage of Population Employed in Mining, Quarrying, & Extraction in North Richland Hills, TX with 0.49%.
What is the Percentage of Population Employed in Mining, Quarrying, & Extraction in North Richland Hills, TX?
Percentage of Population Employed in Mining, Quarrying, & Extraction in North Richland Hills is 0.33%.
What is the Percentage of Population Employed in Mining, Quarrying, & Extraction in Texas?
Percentage of Population Employed in Mining, Quarrying, & Extraction in Texas is 1.9%.
What is the Percentage of Population Employed in Mining, Quarrying, & Extraction in the United States?
Percentage of Population Employed in Mining, Quarrying, & Extraction in the United States is 0.44%.