Zip Codes with the Highest Percentage of Population Employed in Legal Services & Support in Duncanville, TX
RELATED REPORTS & OPTIONS
Legal Services & Support
Duncanville
Compare Zip Codes
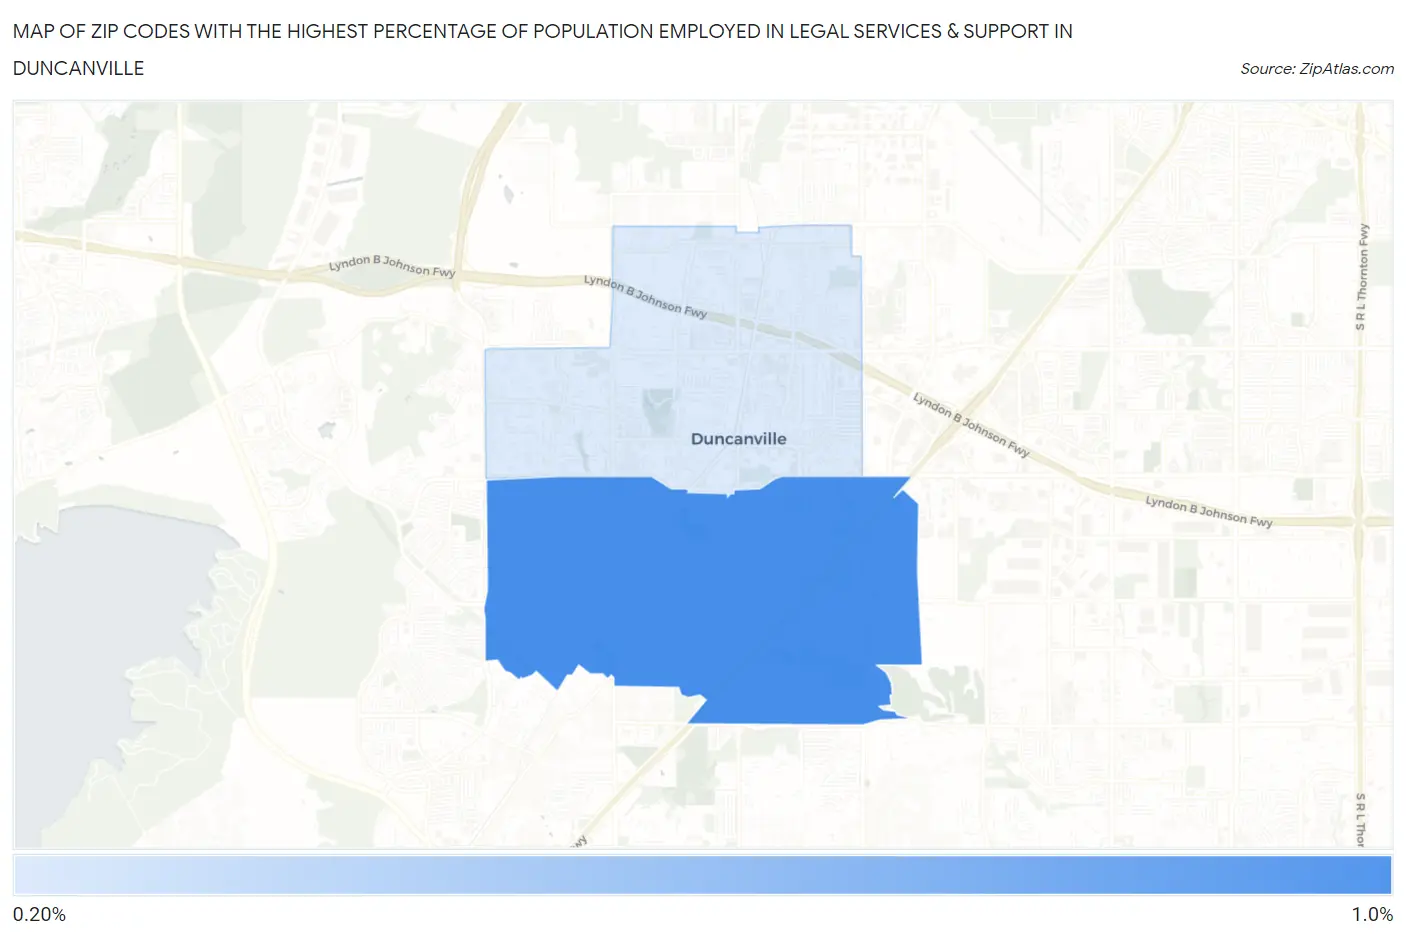
Map of Zip Codes with the Highest Percentage of Population Employed in Legal Services & Support in Duncanville
0.27%
0.88%
Zip Codes with the Highest Percentage of Population Employed in Legal Services & Support in Duncanville, TX
| Zip Code | % Employed | vs State | vs National | |
| 1. | 75137 | 0.88% | 1.0%(-0.124)#495 | 1.2%(-0.300)#8,749 |
| 2. | 75116 | 0.27% | 1.0%(-0.742)#954 | 1.2%(-0.918)#15,441 |
1
Common Questions
What are the Top Zip Codes with the Highest Percentage of Population Employed in Legal Services & Support in Duncanville, TX?
Top Zip Codes with the Highest Percentage of Population Employed in Legal Services & Support in Duncanville, TX are:
What zip code has the Highest Percentage of Population Employed in Legal Services & Support in Duncanville, TX?
75137 has the Highest Percentage of Population Employed in Legal Services & Support in Duncanville, TX with 0.88%.
What is the Percentage of Population Employed in Legal Services & Support in Duncanville, TX?
Percentage of Population Employed in Legal Services & Support in Duncanville is 0.58%.
What is the Percentage of Population Employed in Legal Services & Support in Texas?
Percentage of Population Employed in Legal Services & Support in Texas is 1.0%.
What is the Percentage of Population Employed in Legal Services & Support in the United States?
Percentage of Population Employed in Legal Services & Support in the United States is 1.2%.