Zip Codes with the Highest Percentage of Population Employed in Health Diagnosing & Treating in Duncanville, TX
RELATED REPORTS & OPTIONS
Health Diagnosing & Treating
Duncanville
Compare Zip Codes
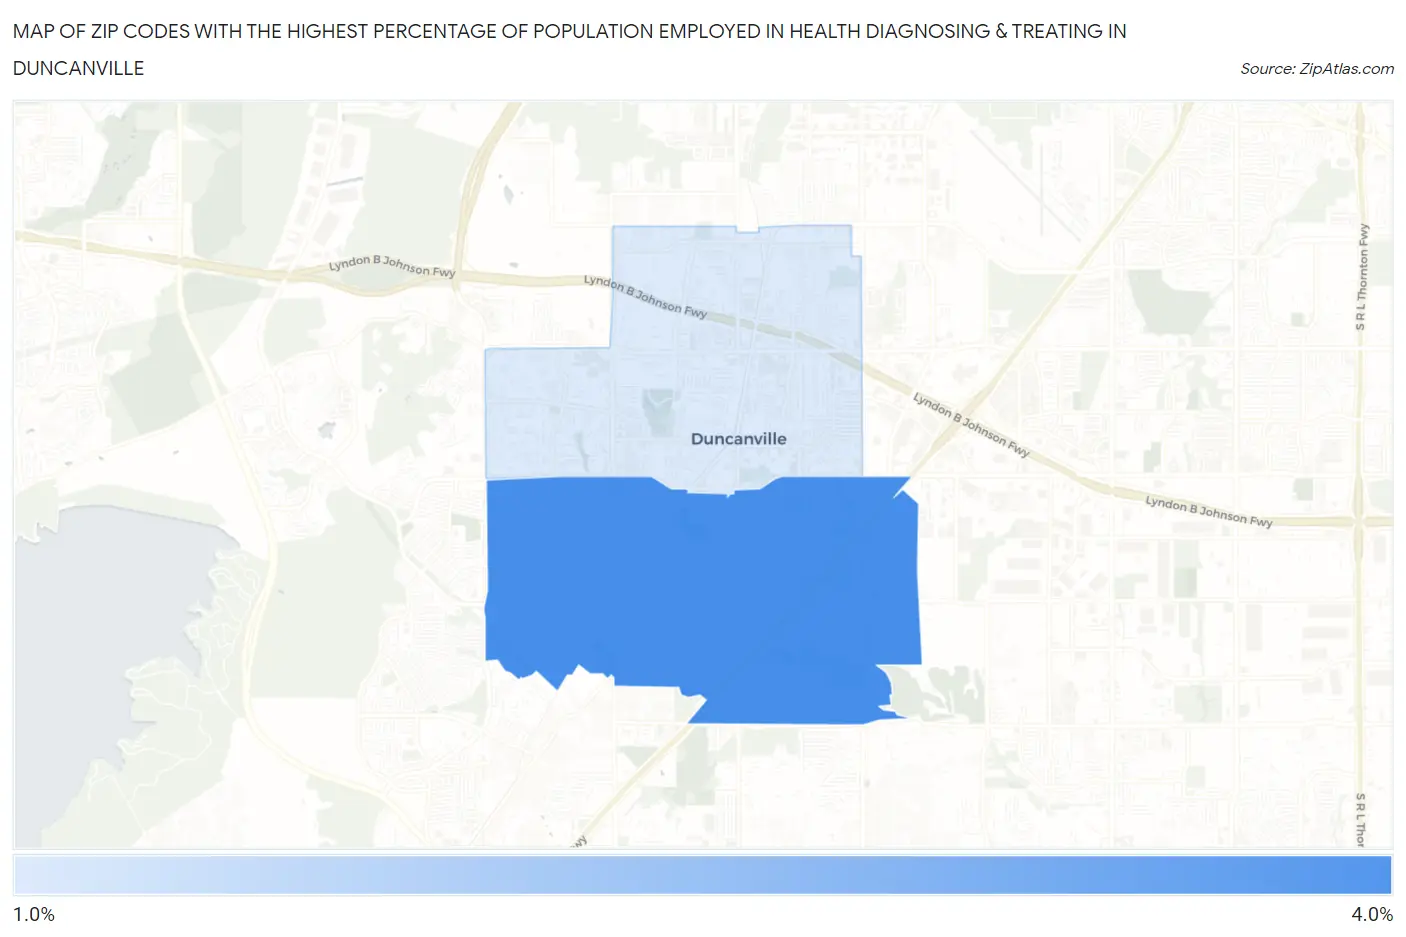
Map of Zip Codes with the Highest Percentage of Population Employed in Health Diagnosing & Treating in Duncanville
1.6%
3.6%
Zip Codes with the Highest Percentage of Population Employed in Health Diagnosing & Treating in Duncanville, TX
| Zip Code | % Employed | vs State | vs National | |
| 1. | 75137 | 3.6% | 5.5%(-1.95)#1,163 | 6.2%(-2.68)#22,716 |
| 2. | 75116 | 1.6% | 5.5%(-3.88)#1,535 | 6.2%(-4.60)#27,019 |
1
Common Questions
What are the Top Zip Codes with the Highest Percentage of Population Employed in Health Diagnosing & Treating in Duncanville, TX?
Top Zip Codes with the Highest Percentage of Population Employed in Health Diagnosing & Treating in Duncanville, TX are:
What zip code has the Highest Percentage of Population Employed in Health Diagnosing & Treating in Duncanville, TX?
75137 has the Highest Percentage of Population Employed in Health Diagnosing & Treating in Duncanville, TX with 3.6%.
What is the Percentage of Population Employed in Health Diagnosing & Treating in Duncanville, TX?
Percentage of Population Employed in Health Diagnosing & Treating in Duncanville is 2.6%.
What is the Percentage of Population Employed in Health Diagnosing & Treating in Texas?
Percentage of Population Employed in Health Diagnosing & Treating in Texas is 5.5%.
What is the Percentage of Population Employed in Health Diagnosing & Treating in the United States?
Percentage of Population Employed in Health Diagnosing & Treating in the United States is 6.2%.