Zip Codes with the Highest Percentage of Population Employed in Sales & Related in Duncanville, TX
RELATED REPORTS & OPTIONS
Sales & Related
Duncanville
Compare Zip Codes
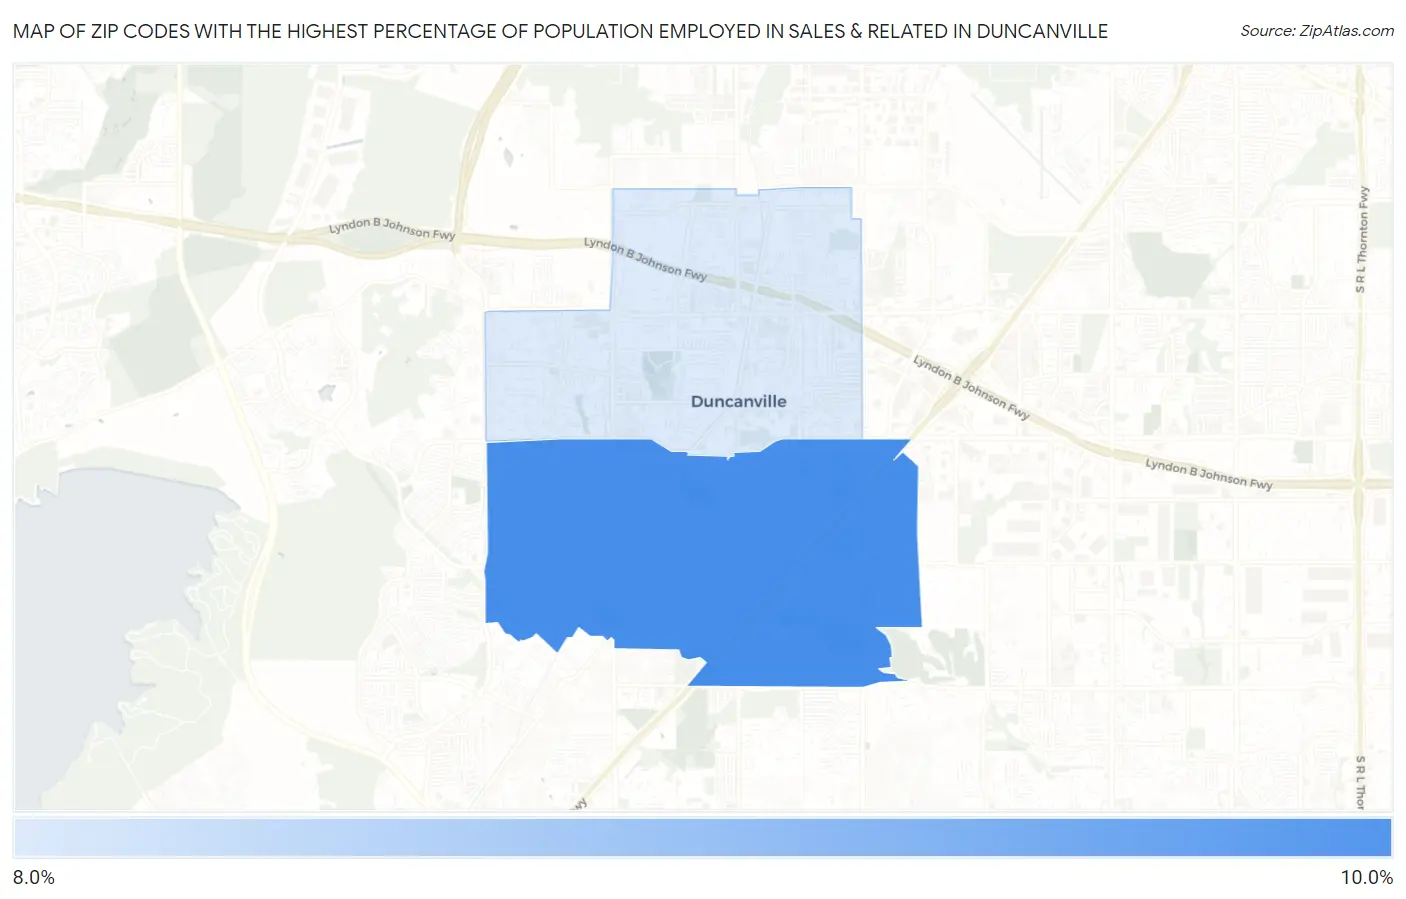
Map of Zip Codes with the Highest Percentage of Population Employed in Sales & Related in Duncanville
8.3%
9.3%
Zip Codes with the Highest Percentage of Population Employed in Sales & Related in Duncanville, TX
| Zip Code | % Employed | vs State | vs National | |
| 1. | 75137 | 9.3% | 10.2%(-0.907)#947 | 9.6%(-0.278)#13,367 |
| 2. | 75116 | 8.3% | 10.2%(-1.94)#1,149 | 9.6%(-1.31)#17,117 |
1
Common Questions
What are the Top Zip Codes with the Highest Percentage of Population Employed in Sales & Related in Duncanville, TX?
Top Zip Codes with the Highest Percentage of Population Employed in Sales & Related in Duncanville, TX are:
What zip code has the Highest Percentage of Population Employed in Sales & Related in Duncanville, TX?
75137 has the Highest Percentage of Population Employed in Sales & Related in Duncanville, TX with 9.3%.
What is the Percentage of Population Employed in Sales & Related in Duncanville, TX?
Percentage of Population Employed in Sales & Related in Duncanville is 8.8%.
What is the Percentage of Population Employed in Sales & Related in Texas?
Percentage of Population Employed in Sales & Related in Texas is 10.2%.
What is the Percentage of Population Employed in Sales & Related in the United States?
Percentage of Population Employed in Sales & Related in the United States is 9.6%.