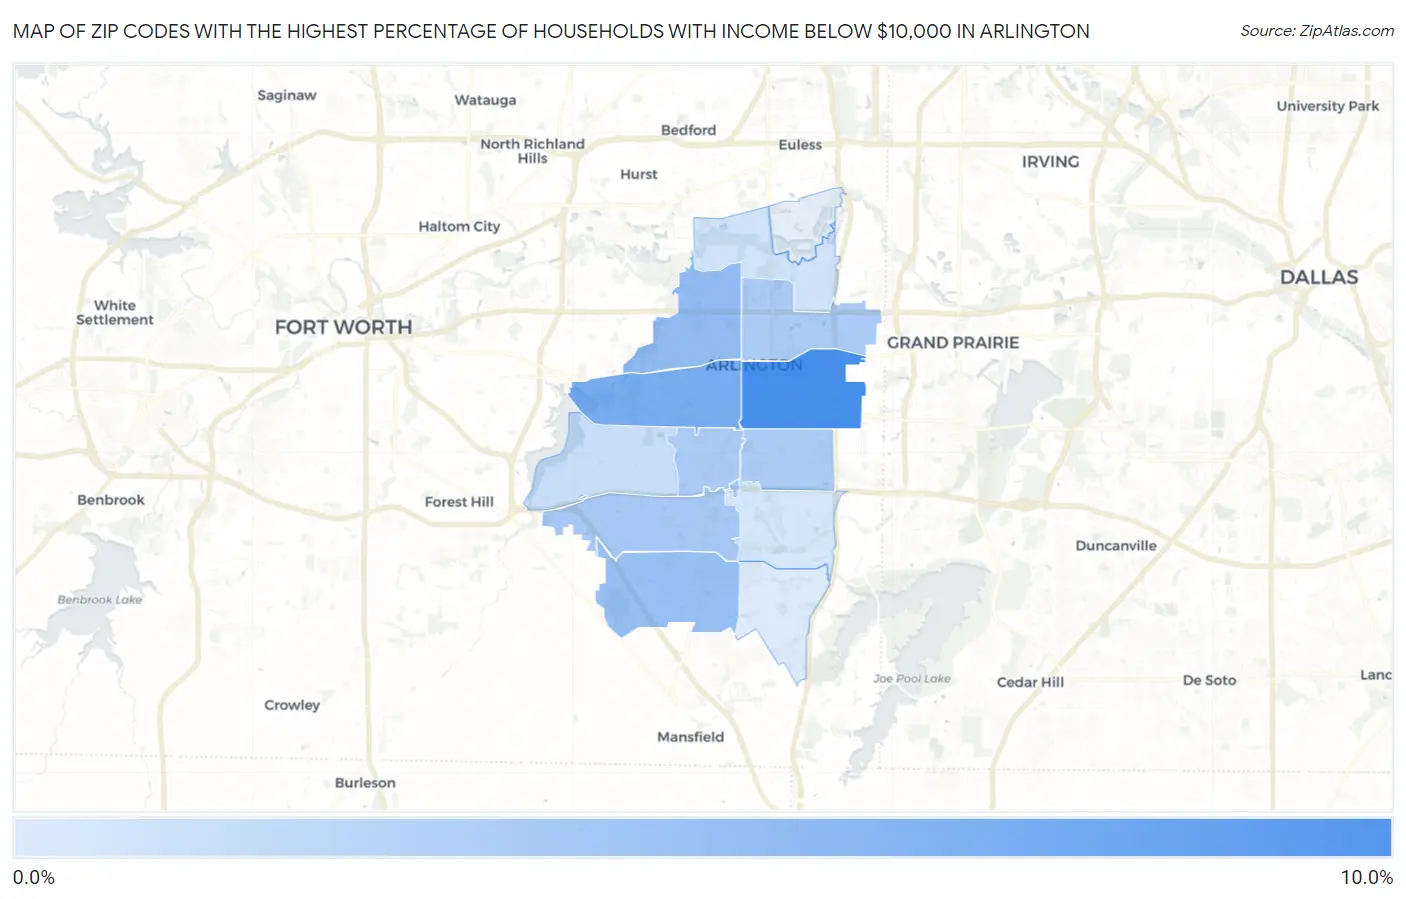
Zip Codes with the Highest Percentage of Households with Income Below $10,000 in Arlington, TX
RELATED REPORTS & OPTIONS
Household Income | $0-10k
Arlington
Compare Zip Codes
Map of Zip Codes with the Highest Percentage of Households with Income Below $10,000 in Arlington
1.4%
8.8%
Zip Codes with the Highest Percentage of Households with Income Below $10,000 in Arlington, TX
| Zip Code | Households with Income < $10k | vs State | vs National | |
| 1. | 76010 | 8.8% | 5.1%(+3.70)#294 | 4.9%(+3.90)#4,601 |
| 2. | 76013 | 6.3% | 5.1%(+1.20)#573 | 4.9%(+1.40)#8,319 |
| 3. | 76012 | 5.1% | 5.1%(=0.000)#759 | 4.9%(+0.200)#11,372 |
| 4. | 76001 | 4.7% | 5.1%(-0.400)#833 | 4.9%(-0.200)#12,638 |
| 5. | 76017 | 4.1% | 5.1%(-1.00)#948 | 4.9%(-0.800)#14,805 |
| 6. | 76011 | 3.9% | 5.1%(-1.20)#1,004 | 4.9%(-1.00)#15,667 |
| 7. | 76015 | 3.9% | 5.1%(-1.20)#1,006 | 4.9%(-1.00)#15,693 |
| 8. | 76014 | 3.8% | 5.1%(-1.30)#1,027 | 4.9%(-1.10)#16,014 |
| 9. | 76016 | 2.4% | 5.1%(-2.70)#1,348 | 4.9%(-2.50)#22,024 |
| 10. | 76006 | 1.9% | 5.1%(-3.20)#1,451 | 4.9%(-3.00)#24,023 |
| 11. | 76018 | 1.7% | 5.1%(-3.40)#1,497 | 4.9%(-3.20)#24,717 |
| 12. | 76002 | 1.4% | 5.1%(-3.70)#1,537 | 4.9%(-3.50)#25,707 |
1
Common Questions
What are the Top 10 Zip Codes with the Highest Percentage of Households with Income Below $10,000 in Arlington, TX?
Top 10 Zip Codes with the Highest Percentage of Households with Income Below $10,000 in Arlington, TX are:
What zip code has the Highest Percentage of Households with Income Below $10,000 in Arlington, TX?
76010 has the Highest Percentage of Households with Income Below $10,000 in Arlington, TX with 8.8%.
What is the Percentage of Households with Income Below $10,000 in Arlington, TX?
Percentage of Households with Income Below $10,000 in Arlington is 4.4%.
What is the Percentage of Households with Income Below $10,000 in Texas?
Percentage of Households with Income Below $10,000 in Texas is 5.1%.
What is the Percentage of Households with Income Below $10,000 in the United States?
Percentage of Households with Income Below $10,000 in the United States is 4.9%.