Zip Codes with the Most Immigrants from Latin America in Arlington, TX
RELATED REPORTS & OPTIONS
Latin America
Arlington
Compare Zip Codes
Map of Zip Codes with the Most Immigrants from Latin America in Arlington
95
14,675
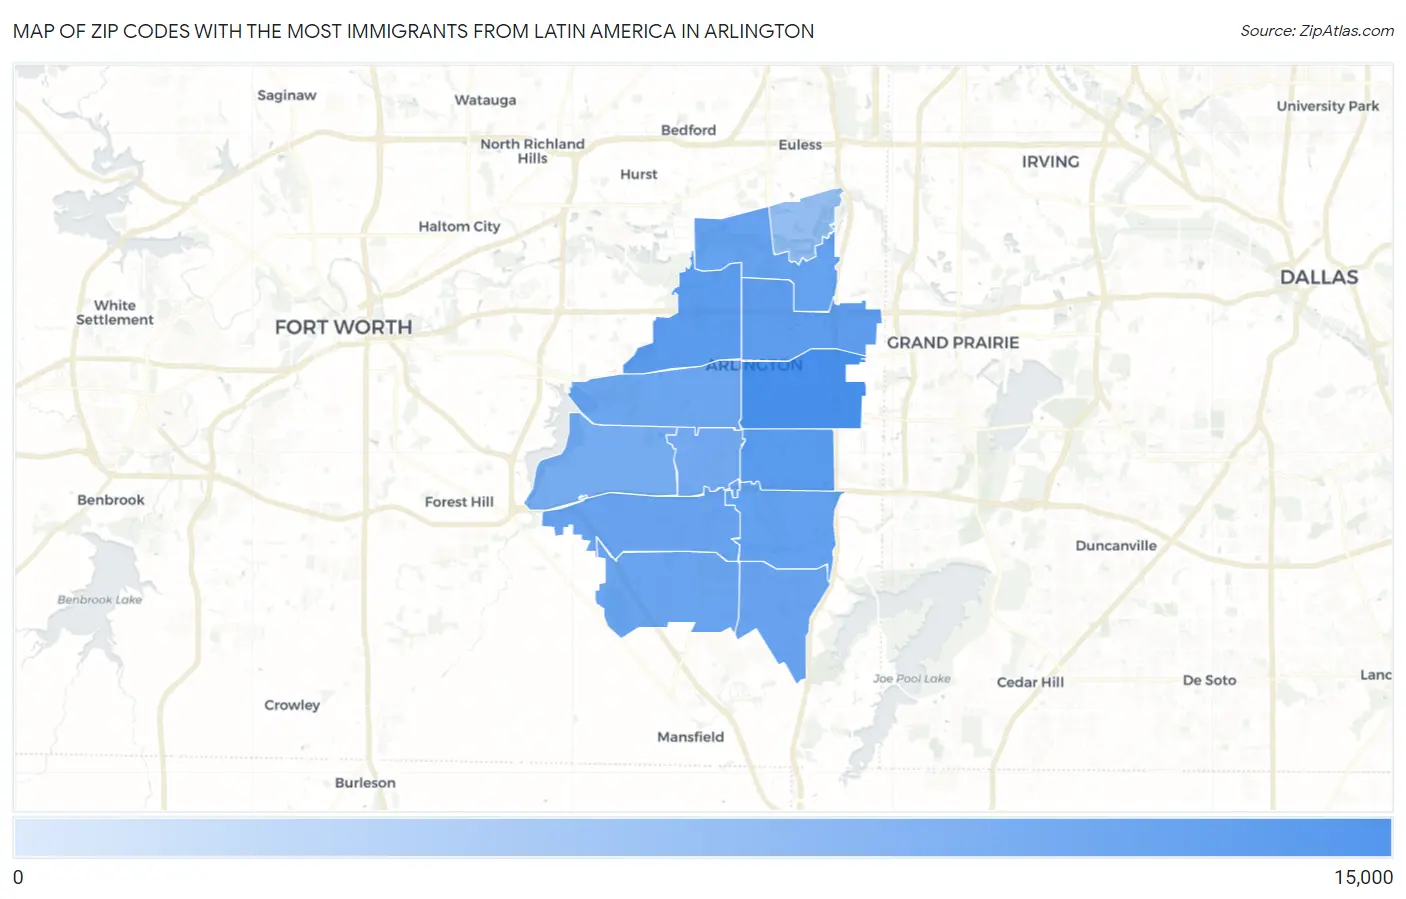
Zip Codes with the Most Immigrants from Latin America in Arlington, TX
| Zip Code | Latin America | vs State | vs National | |
| 1. | 76010 | 14,675 | 3,257,675(0.45%)#31 | 22,649,518(0.06%)#247 |
| 2. | 76014 | 5,512 | 3,257,675(0.17%)#183 | 22,649,518(0.02%)#1,041 |
| 3. | 76012 | 3,887 | 3,257,675(0.12%)#251 | 22,649,518(0.02%)#1,461 |
| 4. | 76011 | 3,483 | 3,257,675(0.11%)#276 | 22,649,518(0.02%)#1,626 |
| 5. | 76018 | 2,564 | 3,257,675(0.08%)#364 | 22,649,518(0.01%)#2,124 |
| 6. | 76006 | 2,244 | 3,257,675(0.07%)#400 | 22,649,518(0.01%)#2,401 |
| 7. | 76017 | 1,833 | 3,257,675(0.06%)#459 | 22,649,518(0.01%)#2,772 |
| 8. | 76002 | 1,772 | 3,257,675(0.05%)#469 | 22,649,518(0.01%)#2,850 |
| 9. | 76001 | 1,631 | 3,257,675(0.05%)#487 | 22,649,518(0.01%)#3,024 |
| 10. | 76013 | 1,445 | 3,257,675(0.04%)#528 | 22,649,518(0.01%)#3,294 |
| 11. | 76015 | 1,094 | 3,257,675(0.03%)#621 | 22,649,518(0.00%)#3,989 |
| 12. | 76016 | 799 | 3,257,675(0.02%)#713 | 22,649,518(0.00%)#4,817 |
| 13. | 76005 | 95 | 3,257,675(0.00%)#1,205 | 22,649,518(0.00%)#11,326 |
1
Common Questions
What are the Top 10 Zip Codes with the Most Immigrants from Latin America in Arlington, TX?
Top 10 Zip Codes with the Most Immigrants from Latin America in Arlington, TX are:
What zip code has the Most Immigrants from Latin America in Arlington, TX?
76010 has the Most Immigrants from Latin America in Arlington, TX with 14,675.
What is the Total Immigrants from Latin America in Arlington, TX?
Total Immigrants from Latin America in Arlington is 40,872.
What is the Total Immigrants from Latin America in Texas?
Total Immigrants from Latin America in Texas is 3,257,675.
What is the Total Immigrants from Latin America in the United States?
Total Immigrants from Latin America in the United States is 22,649,518.