Zip Codes with the Highest Percentage of Population Employed in Legal Services & Support in Arlington, TX
RELATED REPORTS & OPTIONS
Legal Services & Support
Arlington
Compare Zip Codes
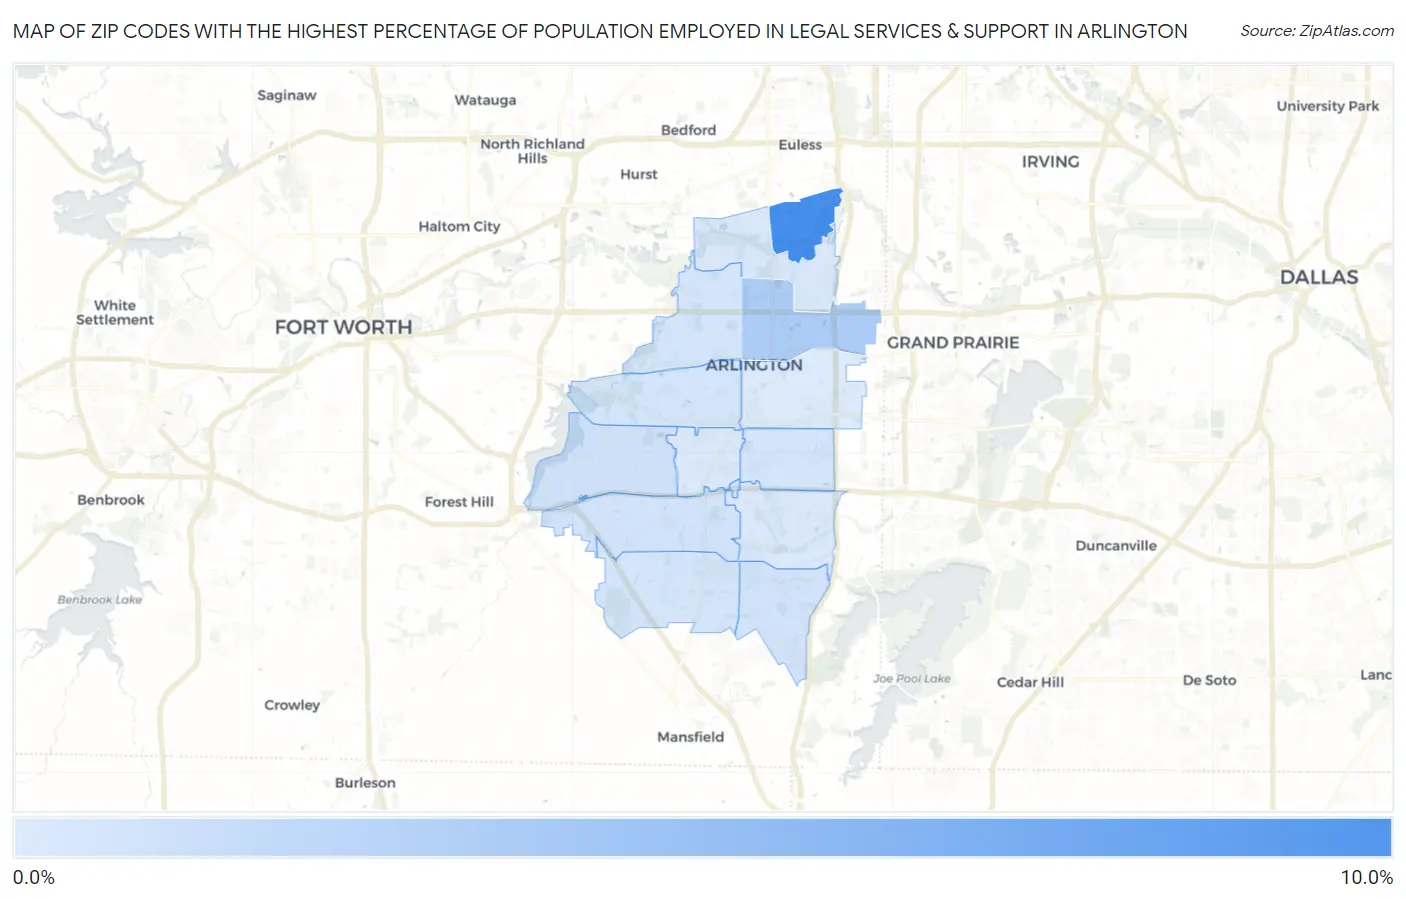
Map of Zip Codes with the Highest Percentage of Population Employed in Legal Services & Support in Arlington
0.19%
8.7%

Zip Codes with the Highest Percentage of Population Employed in Legal Services & Support in Arlington, TX
| Zip Code | % Employed | vs State | vs National | |
| 1. | 76005 | 8.7% | 1.0%(+7.71)#10 | 1.2%(+7.53)#210 |
| 2. | 76011 | 2.8% | 1.0%(+1.84)#110 | 1.2%(+1.66)#2,023 |
| 3. | 76016 | 0.90% | 1.0%(-0.112)#486 | 1.2%(-0.288)#8,638 |
| 4. | 76017 | 0.89% | 1.0%(-0.121)#492 | 1.2%(-0.297)#8,721 |
| 5. | 76002 | 0.85% | 1.0%(-0.158)#506 | 1.2%(-0.334)#9,020 |
| 6. | 76001 | 0.70% | 1.0%(-0.308)#597 | 1.2%(-0.484)#10,405 |
| 7. | 76013 | 0.70% | 1.0%(-0.309)#598 | 1.2%(-0.485)#10,410 |
| 8. | 76014 | 0.70% | 1.0%(-0.310)#601 | 1.2%(-0.485)#10,428 |
| 9. | 76012 | 0.66% | 1.0%(-0.348)#634 | 1.2%(-0.524)#10,843 |
| 10. | 76006 | 0.48% | 1.0%(-0.531)#775 | 1.2%(-0.707)#12,923 |
| 11. | 76015 | 0.36% | 1.0%(-0.645)#876 | 1.2%(-0.820)#14,281 |
| 12. | 76018 | 0.31% | 1.0%(-0.693)#910 | 1.2%(-0.869)#14,859 |
| 13. | 76010 | 0.19% | 1.0%(-0.813)#1,004 | 1.2%(-0.989)#16,255 |
1
Common Questions
What are the Top 10 Zip Codes with the Highest Percentage of Population Employed in Legal Services & Support in Arlington, TX?
Top 10 Zip Codes with the Highest Percentage of Population Employed in Legal Services & Support in Arlington, TX are:
What zip code has the Highest Percentage of Population Employed in Legal Services & Support in Arlington, TX?
76005 has the Highest Percentage of Population Employed in Legal Services & Support in Arlington, TX with 8.7%.
What is the Percentage of Population Employed in Legal Services & Support in Arlington, TX?
Percentage of Population Employed in Legal Services & Support in Arlington is 0.86%.
What is the Percentage of Population Employed in Legal Services & Support in Texas?
Percentage of Population Employed in Legal Services & Support in Texas is 1.0%.
What is the Percentage of Population Employed in Legal Services & Support in the United States?
Percentage of Population Employed in Legal Services & Support in the United States is 1.2%.