Zip Codes with the Highest Percentage of Population Employed in Legal Services & Support in Nashville, TN
RELATED REPORTS & OPTIONS
Legal Services & Support
Nashville
Compare Zip Codes
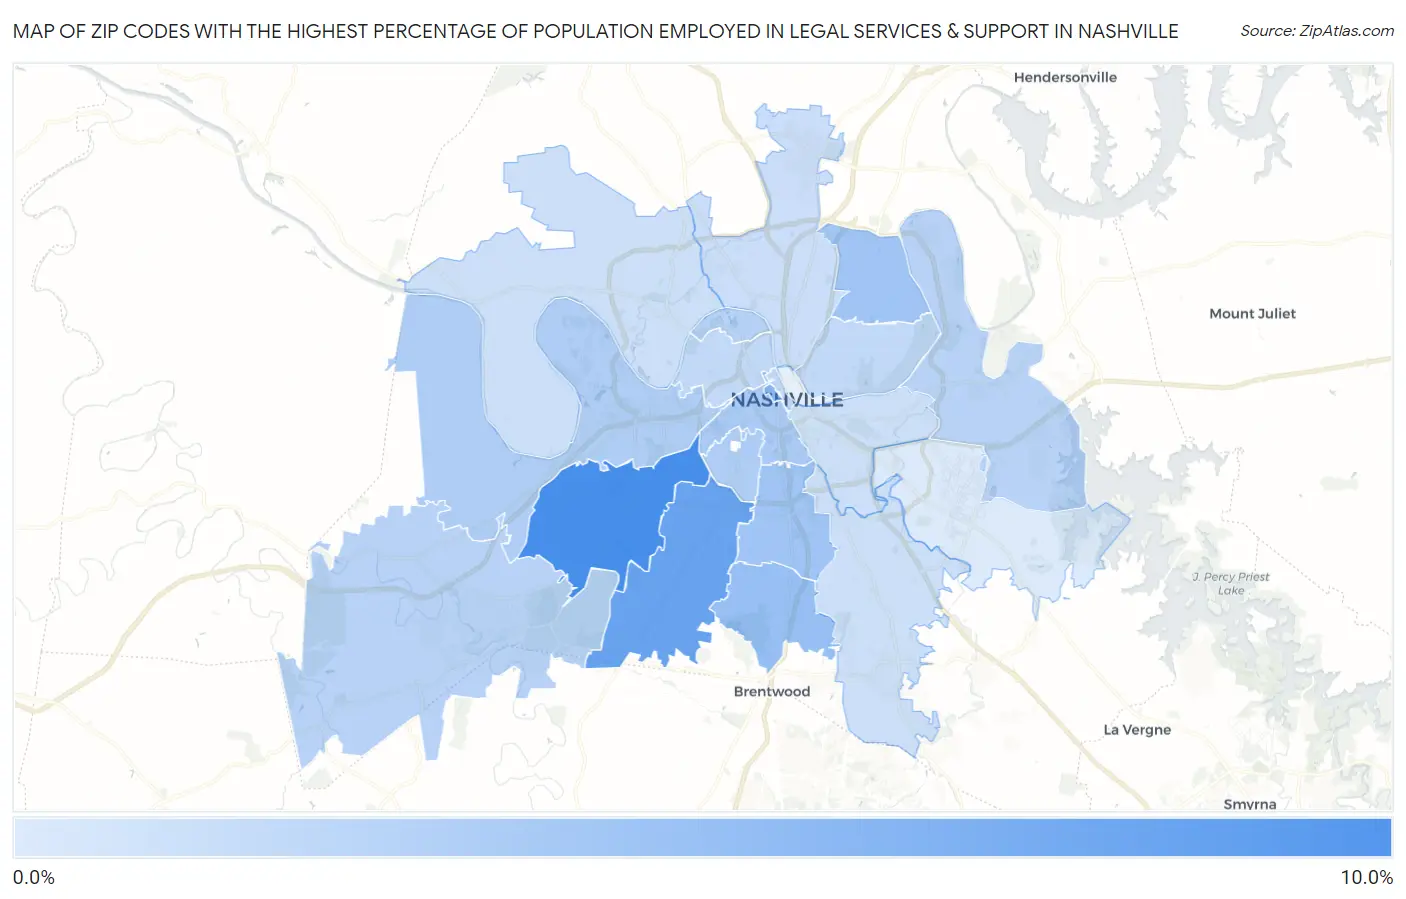
Map of Zip Codes with the Highest Percentage of Population Employed in Legal Services & Support in Nashville
0.093%
8.2%
Zip Codes with the Highest Percentage of Population Employed in Legal Services & Support in Nashville, TN
| Zip Code | % Employed | vs State | vs National | |
| 1. | 37205 | 8.2% | 0.90%(+7.29)#3 | 1.2%(+7.00)#251 |
| 2. | 37215 | 6.3% | 0.90%(+5.43)#6 | 1.2%(+5.15)#422 |
| 3. | 37219 | 4.6% | 0.90%(+3.69)#9 | 1.2%(+3.41)#860 |
| 4. | 37220 | 3.7% | 0.90%(+2.80)#17 | 1.2%(+2.51)#1,287 |
| 5. | 37216 | 3.3% | 0.90%(+2.40)#23 | 1.2%(+2.11)#1,581 |
| 6. | 37204 | 3.2% | 0.90%(+2.30)#24 | 1.2%(+2.02)#1,645 |
| 7. | 37203 | 2.7% | 0.90%(+1.85)#35 | 1.2%(+1.57)#2,137 |
| 8. | 37209 | 2.6% | 0.90%(+1.67)#38 | 1.2%(+1.38)#2,414 |
| 9. | 37212 | 2.6% | 0.90%(+1.66)#39 | 1.2%(+1.37)#2,430 |
| 10. | 37228 | 2.1% | 0.90%(+1.24)#53 | 1.2%(+0.955)#3,159 |
| 11. | 37214 | 2.0% | 0.90%(+1.10)#58 | 1.2%(+0.817)#3,483 |
| 12. | 37221 | 2.0% | 0.90%(+1.10)#59 | 1.2%(+0.809)#3,500 |
| 13. | 37206 | 1.6% | 0.90%(+0.688)#69 | 1.2%(+0.402)#4,729 |
| 14. | 37201 | 1.5% | 0.90%(+0.647)#71 | 1.2%(+0.361)#4,867 |
| 15. | 37208 | 1.5% | 0.90%(+0.616)#76 | 1.2%(+0.330)#4,994 |
| 16. | 37207 | 1.1% | 0.90%(+0.209)#105 | 1.2%(-0.077)#7,119 |
| 17. | 37210 | 0.98% | 0.90%(+0.078)#121 | 1.2%(-0.208)#7,989 |
| 18. | 37211 | 0.94% | 0.90%(+0.044)#128 | 1.2%(-0.242)#8,260 |
| 19. | 37218 | 0.88% | 0.90%(-0.022)#139 | 1.2%(-0.308)#8,814 |
| 20. | 37217 | 0.093% | 0.90%(-0.805)#318 | 1.2%(-1.09)#17,184 |
1
Common Questions
What are the Top 10 Zip Codes with the Highest Percentage of Population Employed in Legal Services & Support in Nashville, TN?
Top 10 Zip Codes with the Highest Percentage of Population Employed in Legal Services & Support in Nashville, TN are:
What zip code has the Highest Percentage of Population Employed in Legal Services & Support in Nashville, TN?
37205 has the Highest Percentage of Population Employed in Legal Services & Support in Nashville, TN with 8.2%.
What is the Percentage of Population Employed in Legal Services & Support in Nashville, TN?
Percentage of Population Employed in Legal Services & Support in Nashville is 1.8%.
What is the Percentage of Population Employed in Legal Services & Support in Tennessee?
Percentage of Population Employed in Legal Services & Support in Tennessee is 0.90%.
What is the Percentage of Population Employed in Legal Services & Support in the United States?
Percentage of Population Employed in Legal Services & Support in the United States is 1.2%.