Zip Codes with the Most Immigrants from Latin America in Morristown, TN
RELATED REPORTS & OPTIONS
Latin America
Morristown
Compare Zip Codes
Map of Zip Codes with the Most Immigrants from Latin America in Morristown
1,321
1,593
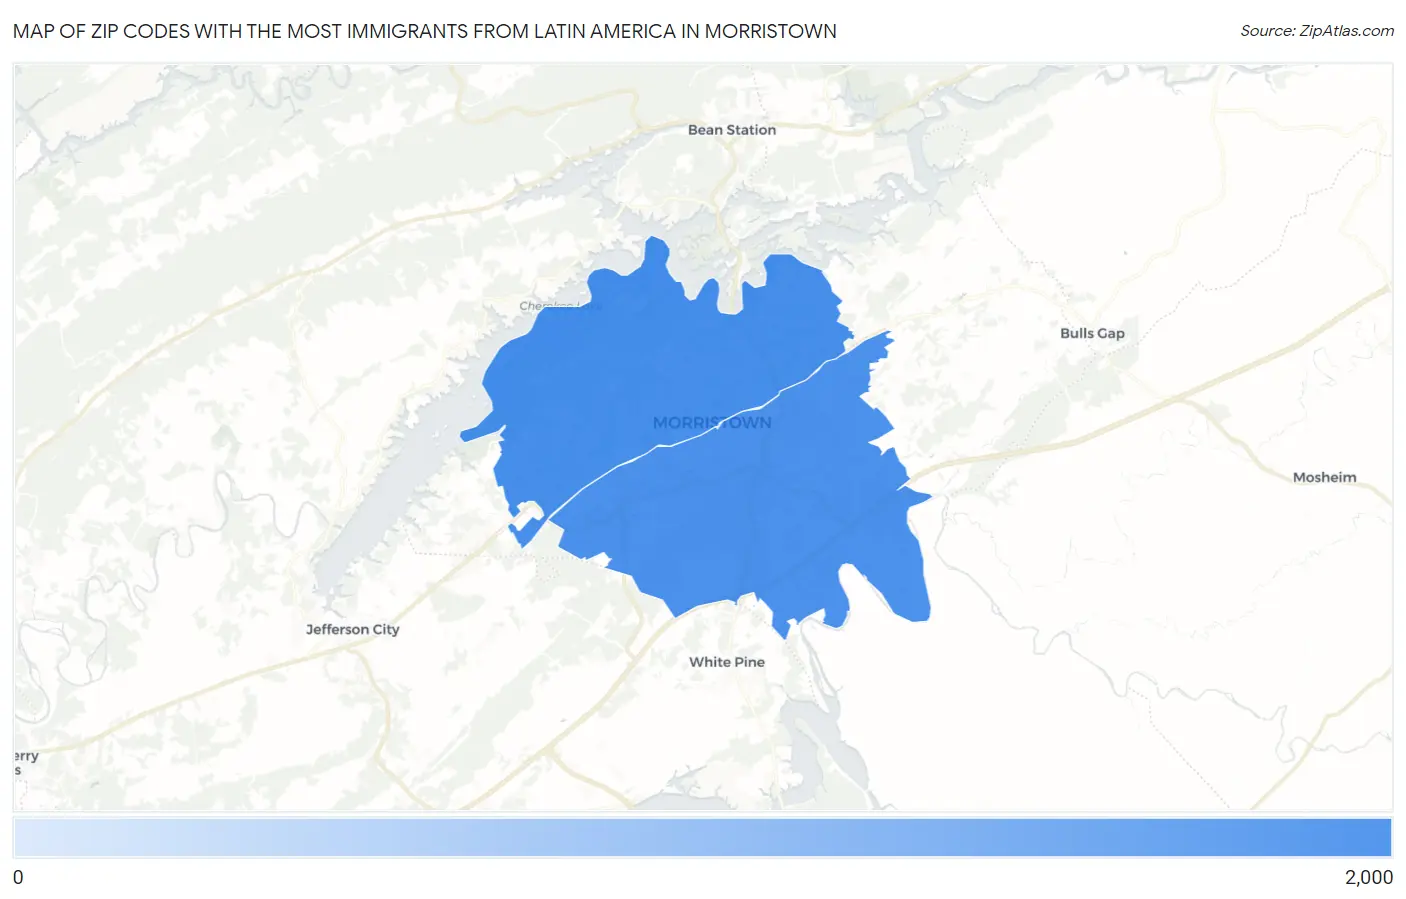
Zip Codes with the Most Immigrants from Latin America in Morristown, TN
| Zip Code | Latin America | vs State | vs National | |
| 1. | 37814 | 1,593 | 171,293(0.93%)#24 | 22,649,518(0.01%)#3,076 |
| 2. | 37813 | 1,321 | 171,293(0.77%)#34 | 22,649,518(0.01%)#3,499 |
1
Common Questions
What are the Top Zip Codes with the Most Immigrants from Latin America in Morristown, TN?
Top Zip Codes with the Most Immigrants from Latin America in Morristown, TN are:
What zip code has the Most Immigrants from Latin America in Morristown, TN?
37814 has the Most Immigrants from Latin America in Morristown, TN with 1,593.
What is the Total Immigrants from Latin America in Morristown, TN?
Total Immigrants from Latin America in Morristown is 2,484.
What is the Total Immigrants from Latin America in Tennessee?
Total Immigrants from Latin America in Tennessee is 171,293.
What is the Total Immigrants from Latin America in the United States?
Total Immigrants from Latin America in the United States is 22,649,518.