Zip Codes with the Highest Percentage of Population Employed in Legal Services & Support in Morristown, TN
RELATED REPORTS & OPTIONS
Legal Services & Support
Morristown
Compare Zip Codes
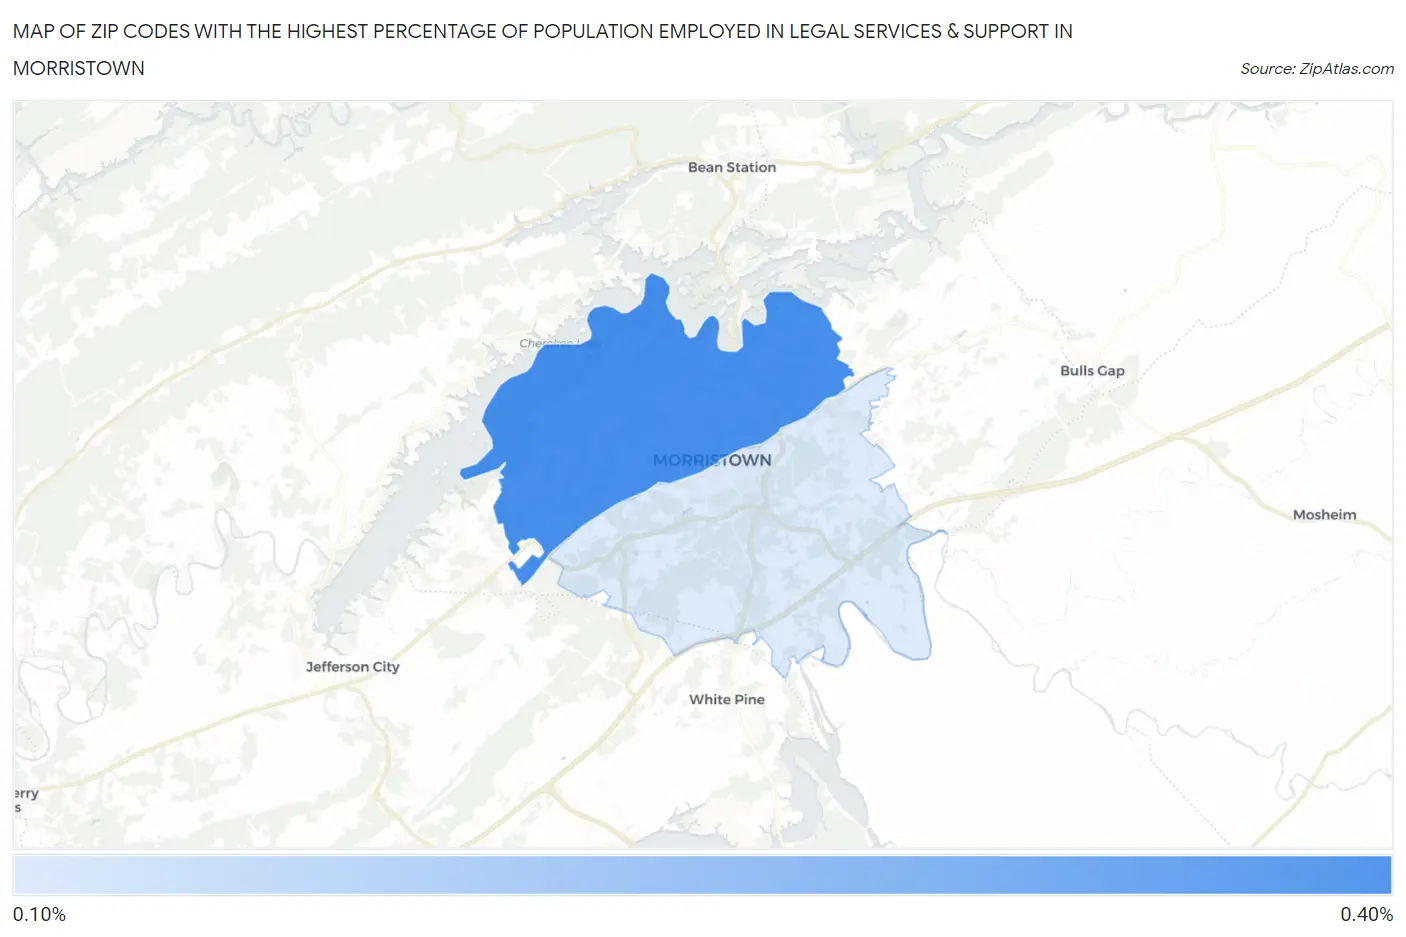
Map of Zip Codes with the Highest Percentage of Population Employed in Legal Services & Support in Morristown
0.13%
0.35%
Zip Codes with the Highest Percentage of Population Employed in Legal Services & Support in Morristown, TN
| Zip Code | % Employed | vs State | vs National | |
| 1. | 37814 | 0.35% | 0.90%(-0.552)#254 | 1.2%(-0.838)#14,513 |
| 2. | 37813 | 0.13% | 0.90%(-0.773)#309 | 1.2%(-1.06)#16,911 |
1
Common Questions
What are the Top Zip Codes with the Highest Percentage of Population Employed in Legal Services & Support in Morristown, TN?
Top Zip Codes with the Highest Percentage of Population Employed in Legal Services & Support in Morristown, TN are:
What zip code has the Highest Percentage of Population Employed in Legal Services & Support in Morristown, TN?
37814 has the Highest Percentage of Population Employed in Legal Services & Support in Morristown, TN with 0.35%.
What is the Percentage of Population Employed in Legal Services & Support in Morristown, TN?
Percentage of Population Employed in Legal Services & Support in Morristown is 0.25%.
What is the Percentage of Population Employed in Legal Services & Support in Tennessee?
Percentage of Population Employed in Legal Services & Support in Tennessee is 0.90%.
What is the Percentage of Population Employed in Legal Services & Support in the United States?
Percentage of Population Employed in Legal Services & Support in the United States is 1.2%.