Zip Codes with the Highest Percentage of Population Employed in Arts, Media & Entertainment in Morristown, TN
RELATED REPORTS & OPTIONS
Arts, Media & Entertainment
Morristown
Compare Zip Codes
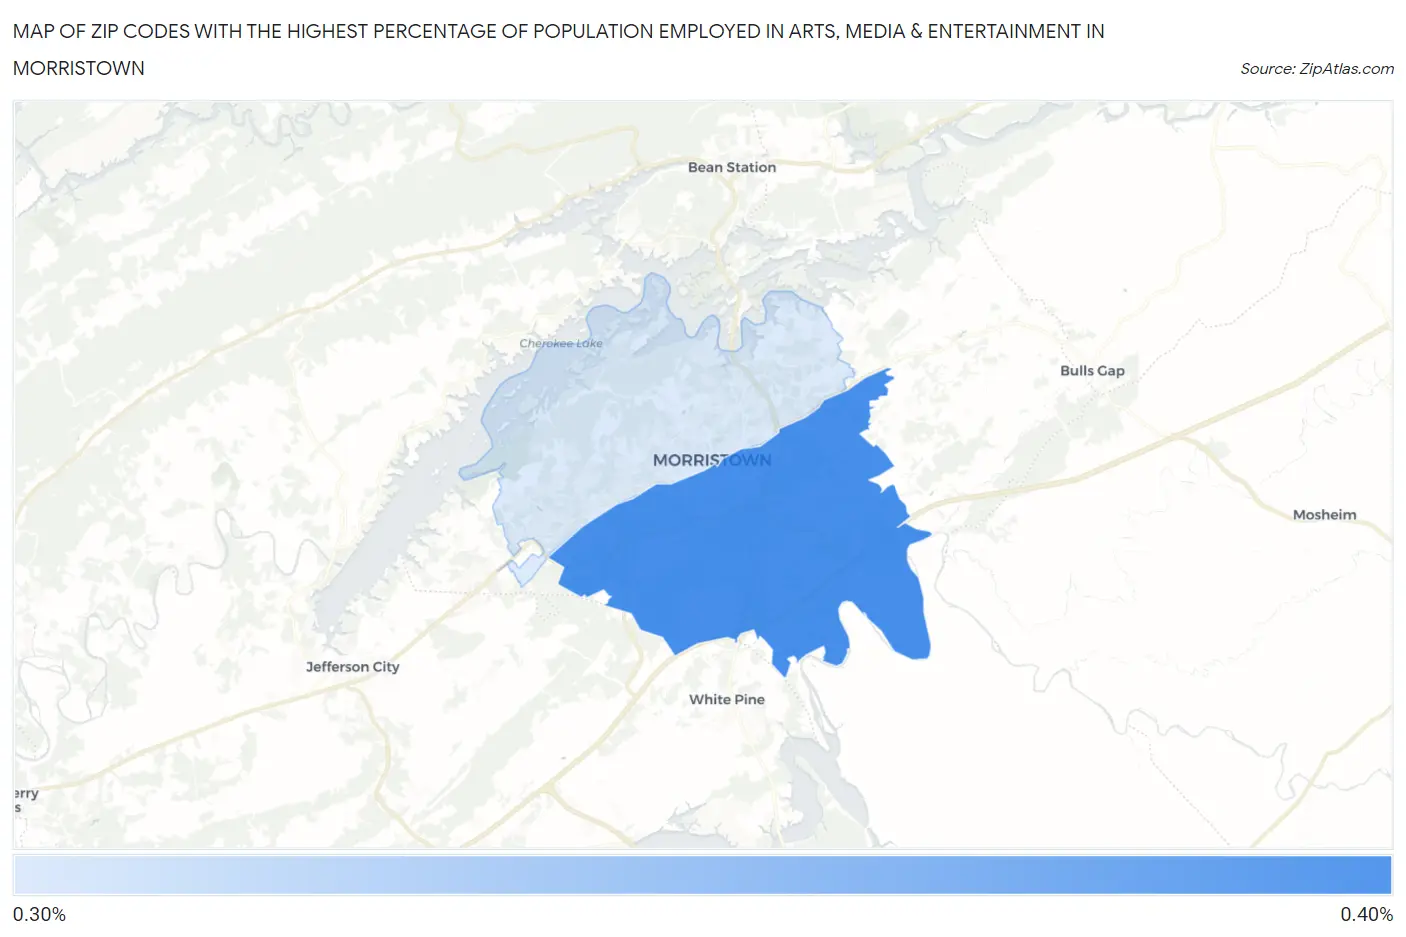
Map of Zip Codes with the Highest Percentage of Population Employed in Arts, Media & Entertainment in Morristown
0.35%
0.36%
Zip Codes with the Highest Percentage of Population Employed in Arts, Media & Entertainment in Morristown, TN
| Zip Code | % Employed | vs State | vs National | |
| 1. | 37813 | 0.36% | 1.9%(-1.58)#384 | 2.1%(-1.70)#19,918 |
| 2. | 37814 | 0.35% | 1.9%(-1.60)#386 | 2.1%(-1.72)#20,021 |
1
Common Questions
What are the Top Zip Codes with the Highest Percentage of Population Employed in Arts, Media & Entertainment in Morristown, TN?
Top Zip Codes with the Highest Percentage of Population Employed in Arts, Media & Entertainment in Morristown, TN are:
What zip code has the Highest Percentage of Population Employed in Arts, Media & Entertainment in Morristown, TN?
37813 has the Highest Percentage of Population Employed in Arts, Media & Entertainment in Morristown, TN with 0.36%.
What is the Percentage of Population Employed in Arts, Media & Entertainment in Morristown, TN?
Percentage of Population Employed in Arts, Media & Entertainment in Morristown is 0.56%.
What is the Percentage of Population Employed in Arts, Media & Entertainment in Tennessee?
Percentage of Population Employed in Arts, Media & Entertainment in Tennessee is 1.9%.
What is the Percentage of Population Employed in Arts, Media & Entertainment in the United States?
Percentage of Population Employed in Arts, Media & Entertainment in the United States is 2.1%.