Alianza, PR Map & Demographics
Alianza Map
Alianza Overview
$11,268
PER CAPITA INCOME
$21,623
AVG FAMILY INCOME
$18,909
AVG HOUSEHOLD INCOME
43.4%
WAGE / INCOME GAP [ % ]
56.6¢/ $1
WAGE / INCOME GAP [ $ ]
0.49
INEQUALITY / GINI INDEX
2,010
TOTAL POPULATION
1,136
MALE POPULATION
874
FEMALE POPULATION
129.98
MALES / 100 FEMALES
76.94
FEMALES / 100 MALES
50.9
MEDIAN AGE
2.9
AVG FAMILY SIZE
2.4
AVG HOUSEHOLD SIZE
577
LABOR FORCE [ PEOPLE ]
32.4%
PERCENT IN LABOR FORCE
3.8%
UNEMPLOYMENT RATE
Income in Alianza
Income Overview in Alianza
Per Capita Income in Alianza is $11,268, while median incomes of families and households are $21,623 and $18,909 respectively.
| Characteristic | Number | Measure |
| Per Capita Income | 2,010 | $11,268 |
| Median Family Income | 583 | $21,623 |
| Mean Family Income | 583 | $31,507 |
| Median Household Income | 835 | $18,909 |
| Mean Household Income | 835 | $26,303 |
| Income Deficit | 583 | $0 |
| Wage / Income Gap (%) | 2,010 | 43.43% |
| Wage / Income Gap ($) | 2,010 | 56.57¢ per $1 |
| Gini / Inequality Index | 2,010 | 0.49 |
Earnings by Sex in Alianza
Average Earnings in Alianza are $16,194, $13,750 for men and $24,306 for women, a difference of 43.4%.
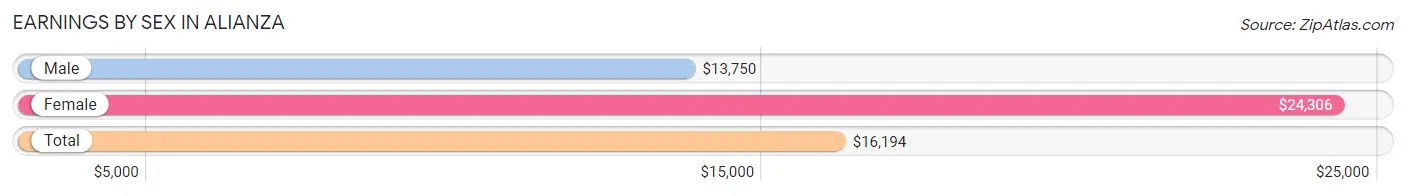
| Sex | Number | Average Earnings |
| Male | 422 (73.9%) | $13,750 |
| Female | 149 (26.1%) | $24,306 |
| Total | 571 (100.0%) | $16,194 |
Earnings by Sex by Income Bracket in Alianza
The most common earnings brackets in Alianza are $15,000 to $17,499 for men (79 | 18.7%) and $22,500 to $24,999 for women (45 | 30.2%).
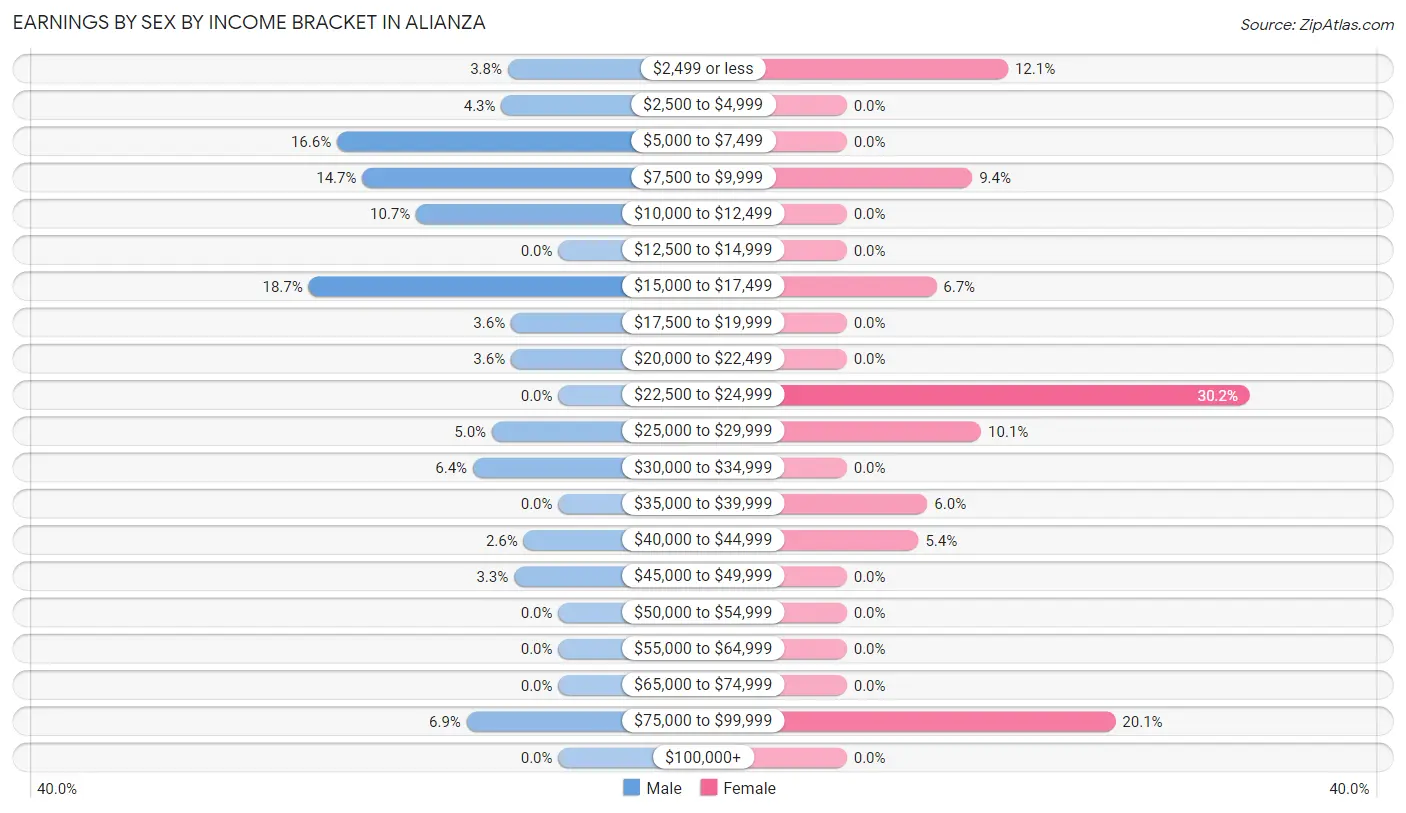
| Income | Male | Female |
| $2,499 or less | 16 (3.8%) | 18 (12.1%) |
| $2,500 to $4,999 | 18 (4.3%) | 0 (0.0%) |
| $5,000 to $7,499 | 70 (16.6%) | 0 (0.0%) |
| $7,500 to $9,999 | 62 (14.7%) | 14 (9.4%) |
| $10,000 to $12,499 | 45 (10.7%) | 0 (0.0%) |
| $12,500 to $14,999 | 0 (0.0%) | 0 (0.0%) |
| $15,000 to $17,499 | 79 (18.7%) | 10 (6.7%) |
| $17,500 to $19,999 | 15 (3.5%) | 0 (0.0%) |
| $20,000 to $22,499 | 15 (3.5%) | 0 (0.0%) |
| $22,500 to $24,999 | 0 (0.0%) | 45 (30.2%) |
| $25,000 to $29,999 | 21 (5.0%) | 15 (10.1%) |
| $30,000 to $34,999 | 27 (6.4%) | 0 (0.0%) |
| $35,000 to $39,999 | 0 (0.0%) | 9 (6.0%) |
| $40,000 to $44,999 | 11 (2.6%) | 8 (5.4%) |
| $45,000 to $49,999 | 14 (3.3%) | 0 (0.0%) |
| $50,000 to $54,999 | 0 (0.0%) | 0 (0.0%) |
| $55,000 to $64,999 | 0 (0.0%) | 0 (0.0%) |
| $65,000 to $74,999 | 0 (0.0%) | 0 (0.0%) |
| $75,000 to $99,999 | 29 (6.9%) | 30 (20.1%) |
| $100,000+ | 0 (0.0%) | 0 (0.0%) |
| Total | 422 (100.0%) | 149 (100.0%) |
Earnings by Sex by Educational Attainment in Alianza
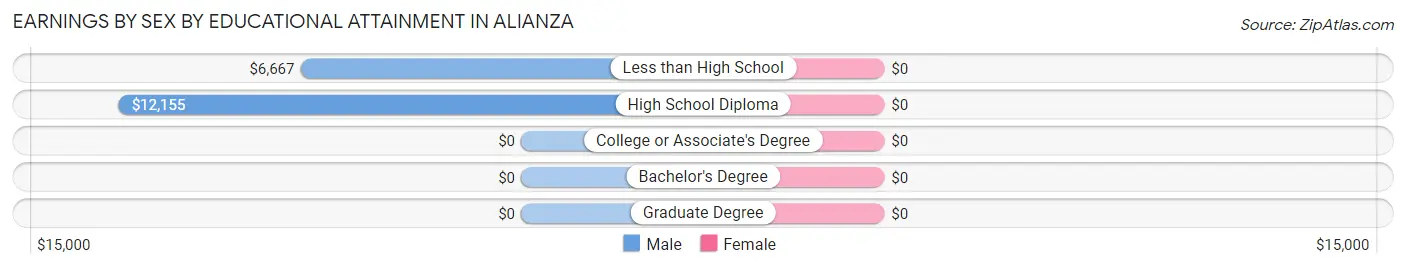
| Educational Attainment | Male Income | Female Income |
| Less than High School | $6,667 | $0 |
| High School Diploma | $12,155 | $0 |
| College or Associate's Degree | - | - |
| Bachelor's Degree | - | - |
| Graduate Degree | - | - |
| Total | $15,206 | $24,806 |
Family Income in Alianza
Family Income Brackets in Alianza
According to the Alianza family income data, there are 130 families falling into the $15,000 to $24,999 income range, which is the most common income bracket and makes up 22.3% of all families.
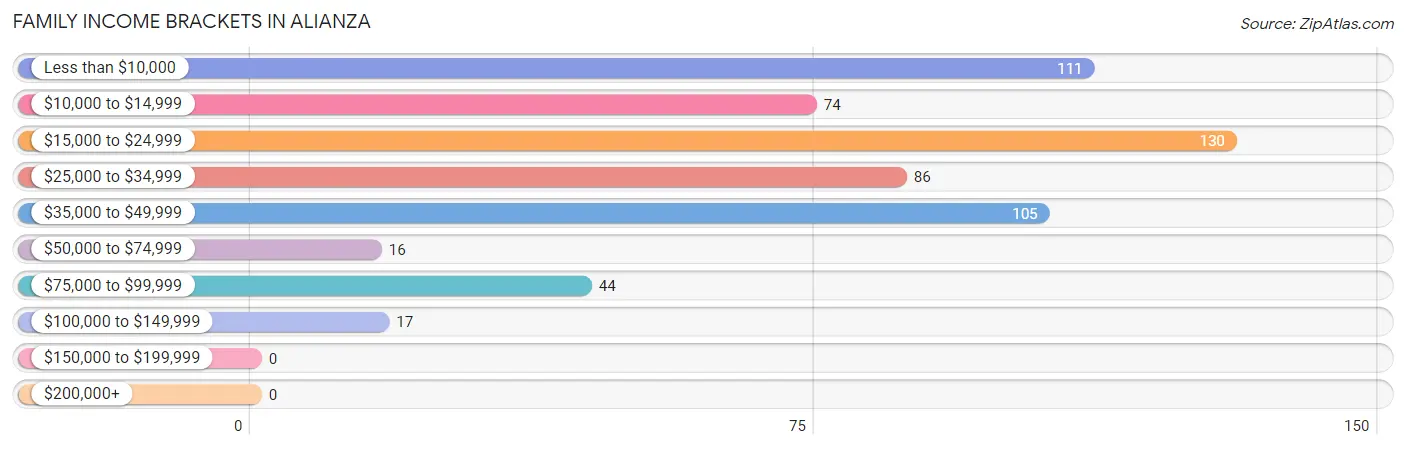
| Income Bracket | # Families | % Families |
| Less than $10,000 | 111 | 19.0% |
| $10,000 to $14,999 | 74 | 12.7% |
| $15,000 to $24,999 | 130 | 22.3% |
| $25,000 to $34,999 | 86 | 14.8% |
| $35,000 to $49,999 | 105 | 18.0% |
| $50,000 to $74,999 | 16 | 2.7% |
| $75,000 to $99,999 | 44 | 7.5% |
| $100,000 to $149,999 | 17 | 2.9% |
| $150,000 to $199,999 | 0 | 0.0% |
| $200,000+ | 0 | 0.0% |
Family Income by Famaliy Size in Alianza
2-person families (345 | 59.2%) account for the highest median family income in Alianza with $20,949 per family, while 2-person families (345 | 59.2%) have the highest median income of $10,474 per family member.
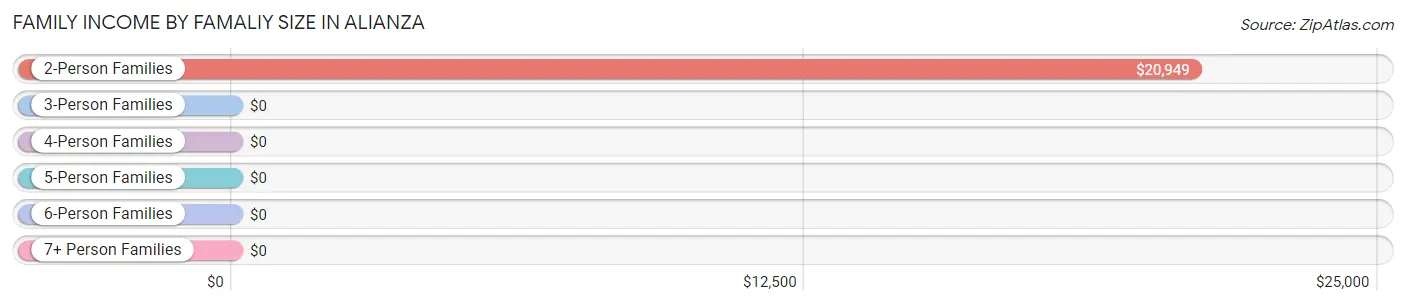
| Income Bracket | # Families | Median Income |
| 2-Person Families | 345 (59.2%) | $20,949 |
| 3-Person Families | 152 (26.1%) | $0 |
| 4-Person Families | 60 (10.3%) | $0 |
| 5-Person Families | 26 (4.5%) | $0 |
| 6-Person Families | 0 (0.0%) | $0 |
| 7+ Person Families | 0 (0.0%) | $0 |
| Total | 583 (100.0%) | $21,623 |
Family Income by Number of Earners in Alianza
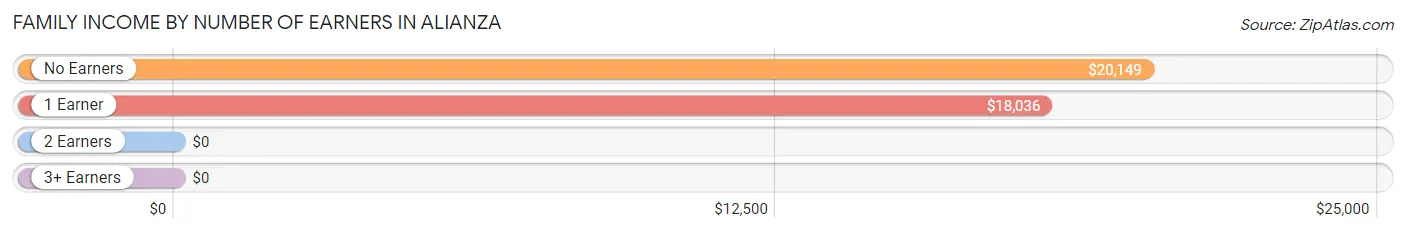
| Number of Earners | # Families | Median Income |
| No Earners | 283 (48.5%) | $20,149 |
| 1 Earner | 196 (33.6%) | $18,036 |
| 2 Earners | 88 (15.1%) | $0 |
| 3+ Earners | 16 (2.7%) | $0 |
| Total | 583 (100.0%) | $21,623 |
Household Income in Alianza
Household Income Brackets in Alianza
With 239 households falling in the category, the less than $10,000 income range is the most frequent in Alianza, accounting for 28.6% of all households.
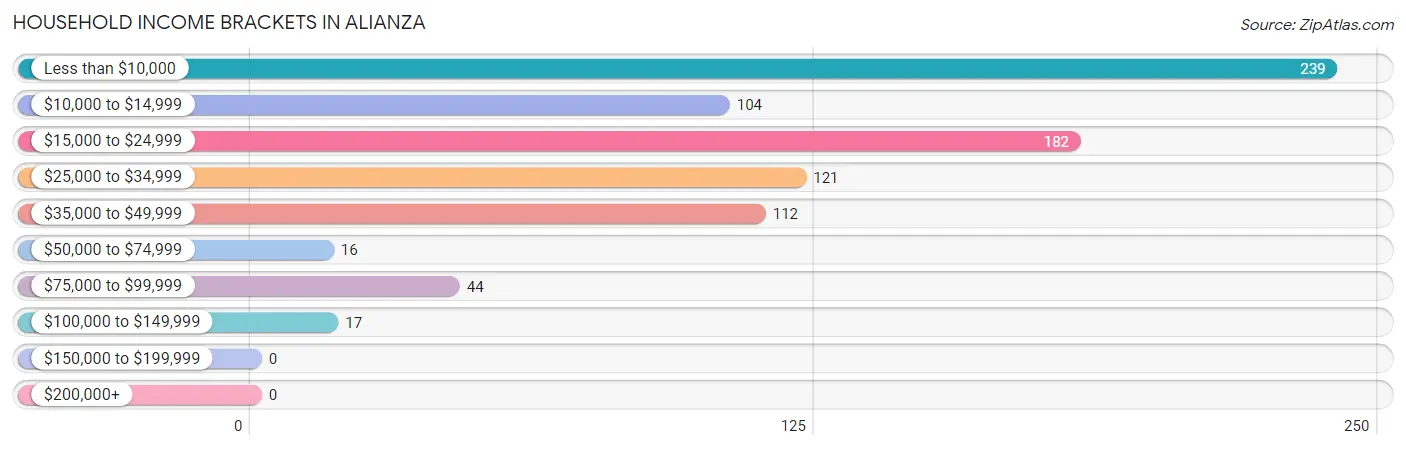
| Income Bracket | # Households | % Households |
| Less than $10,000 | 239 | 28.6% |
| $10,000 to $14,999 | 104 | 12.5% |
| $15,000 to $24,999 | 182 | 21.8% |
| $25,000 to $34,999 | 121 | 14.5% |
| $35,000 to $49,999 | 112 | 13.4% |
| $50,000 to $74,999 | 16 | 1.9% |
| $75,000 to $99,999 | 44 | 5.3% |
| $100,000 to $149,999 | 17 | 2.0% |
| $150,000 to $199,999 | 0 | 0.0% |
| $200,000+ | 0 | 0.0% |
Household Income by Householder Age in Alianza
The median household income in Alianza is $18,909, with the highest median household income of $26,786 found in the 25 to 44 years age bracket for the primary householder. A total of 196 households (23.5%) fall into this category.
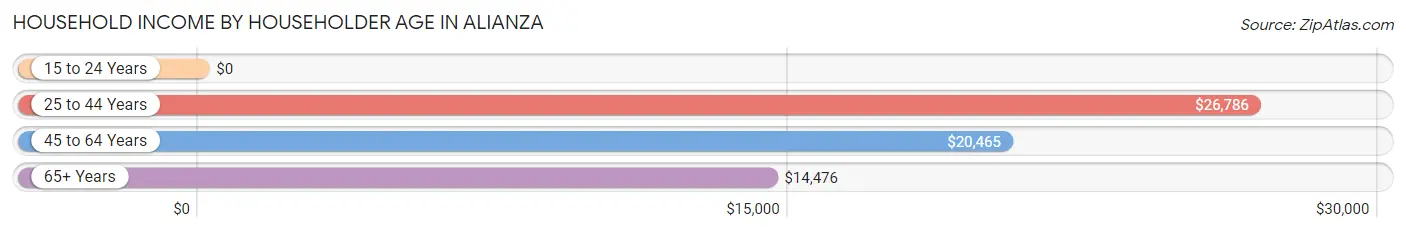
| Income Bracket | # Households | Median Income |
| 15 to 24 Years | 0 (0.0%) | $0 |
| 25 to 44 Years | 196 (23.5%) | $26,786 |
| 45 to 64 Years | 318 (38.1%) | $20,465 |
| 65+ Years | 321 (38.4%) | $14,476 |
| Total | 835 (100.0%) | $18,909 |
Poverty in Alianza
Income Below Poverty by Sex and Age in Alianza
With 50.3% poverty level for males and 42.7% for females among the residents of Alianza, 6 to 11 year old males and 18 to 24 year old females are the most vulnerable to poverty, with 63 males (100.0%) and 30 females (62.5%) in their respective age groups living below the poverty level.
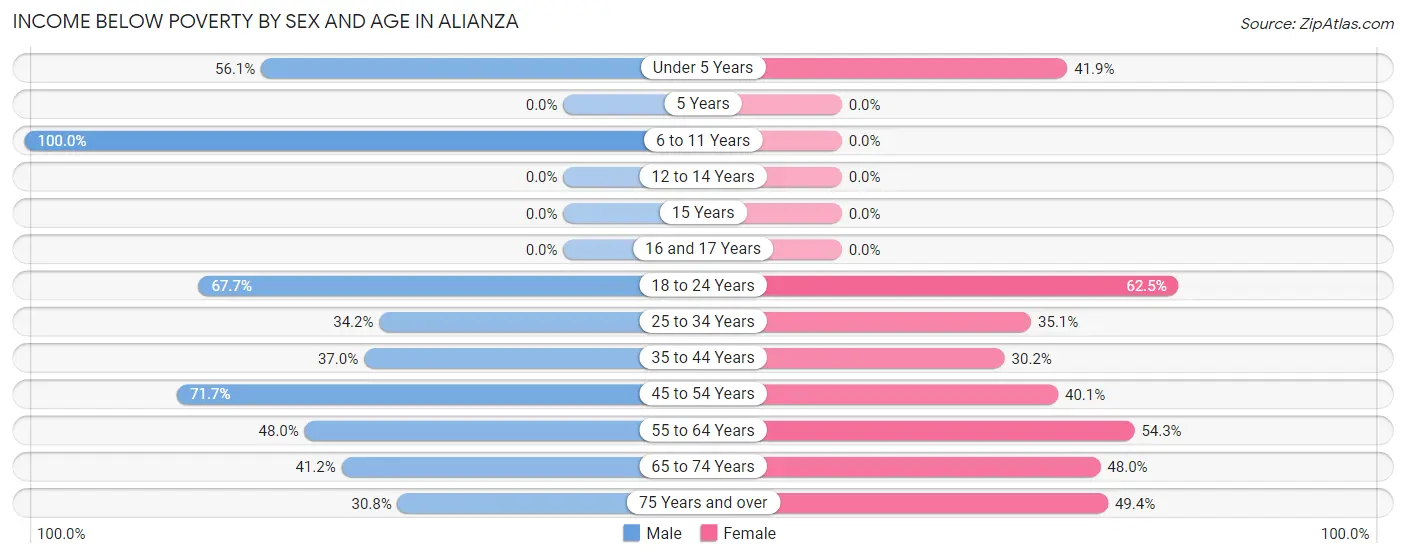
| Age Bracket | Male | Female |
| Under 5 Years | 23 (56.1%) | 18 (41.9%) |
| 5 Years | 0 (0.0%) | 0 (0.0%) |
| 6 to 11 Years | 63 (100.0%) | 0 (0.0%) |
| 12 to 14 Years | 0 (0.0%) | 0 (0.0%) |
| 15 Years | 0 (0.0%) | 0 (0.0%) |
| 16 and 17 Years | 0 (0.0%) | 0 (0.0%) |
| 18 to 24 Years | 86 (67.7%) | 30 (62.5%) |
| 25 to 34 Years | 41 (34.2%) | 13 (35.1%) |
| 35 to 44 Years | 57 (37.0%) | 26 (30.2%) |
| 45 to 54 Years | 119 (71.7%) | 59 (40.1%) |
| 55 to 64 Years | 73 (48.0%) | 88 (54.3%) |
| 65 to 74 Years | 98 (41.2%) | 96 (48.0%) |
| 75 Years and over | 12 (30.8%) | 42 (49.4%) |
| Total | 572 (50.3%) | 372 (42.7%) |
Income Above Poverty by Sex and Age in Alianza
According to the poverty statistics in Alianza, males aged 12 to 14 years and females aged 6 to 11 years are the age groups that are most secure financially, with 100.0% of males and 100.0% of females in these age groups living above the poverty line.
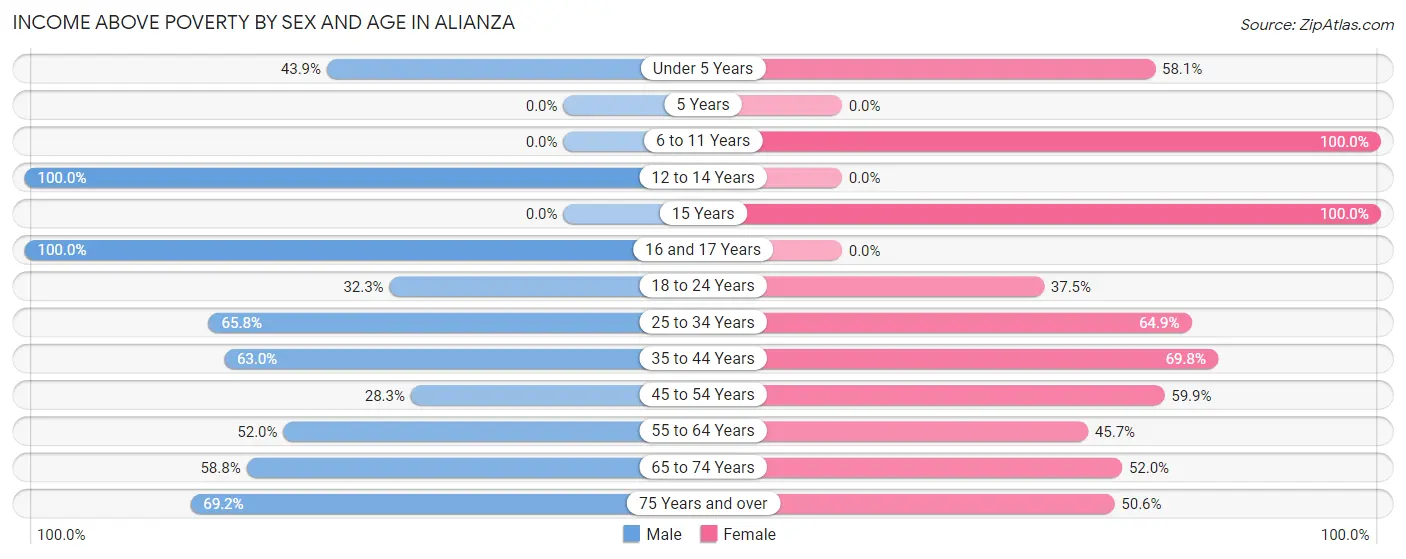
| Age Bracket | Male | Female |
| Under 5 Years | 18 (43.9%) | 25 (58.1%) |
| 5 Years | 0 (0.0%) | 0 (0.0%) |
| 6 to 11 Years | 0 (0.0%) | 28 (100.0%) |
| 12 to 14 Years | 18 (100.0%) | 0 (0.0%) |
| 15 Years | 0 (0.0%) | 35 (100.0%) |
| 16 and 17 Years | 18 (100.0%) | 0 (0.0%) |
| 18 to 24 Years | 41 (32.3%) | 18 (37.5%) |
| 25 to 34 Years | 79 (65.8%) | 24 (64.9%) |
| 35 to 44 Years | 97 (63.0%) | 60 (69.8%) |
| 45 to 54 Years | 47 (28.3%) | 88 (59.9%) |
| 55 to 64 Years | 79 (52.0%) | 74 (45.7%) |
| 65 to 74 Years | 140 (58.8%) | 104 (52.0%) |
| 75 Years and over | 27 (69.2%) | 43 (50.6%) |
| Total | 564 (49.6%) | 499 (57.3%) |
Income Below Poverty Among Married-Couple Families in Alianza
The poverty statistics for married-couple families in Alianza show that 33.6% or 150 of the total 446 families live below the poverty line. Families with 3 or 4 children have the highest poverty rate of 100.0%, comprising of 26 families. On the other hand, families with 1 or 2 children have the lowest poverty rate of 0.0%, which includes 0 families.
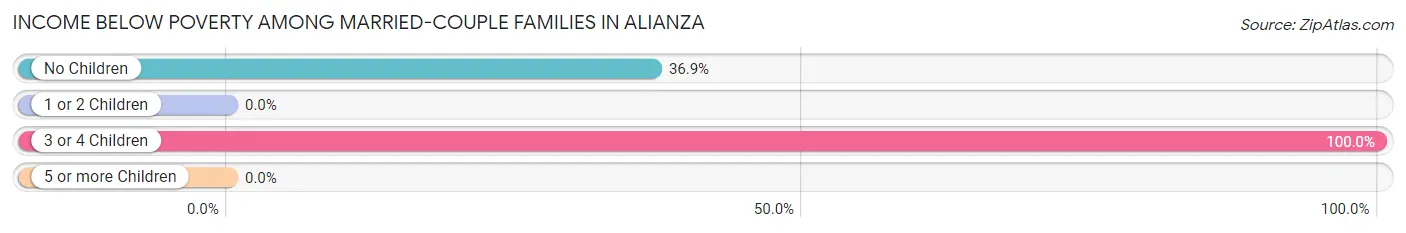
| Children | Above Poverty | Below Poverty |
| No Children | 212 (63.1%) | 124 (36.9%) |
| 1 or 2 Children | 84 (100.0%) | 0 (0.0%) |
| 3 or 4 Children | 0 (0.0%) | 26 (100.0%) |
| 5 or more Children | 0 (0.0%) | 0 (0.0%) |
| Total | 296 (66.4%) | 150 (33.6%) |
Income Below Poverty Among Single-Parent Households in Alianza
According to the poverty data in Alianza, 66.7% or 14 single-father households and 49.1% or 57 single-mother households are living below the poverty line. Among single-father households, those with 1 or 2 children have the highest poverty rate, with 14 households (100.0%) experiencing poverty. Likewise, among single-mother households, those with no children have the highest poverty rate, with 48 households (71.6%) falling below the poverty line.
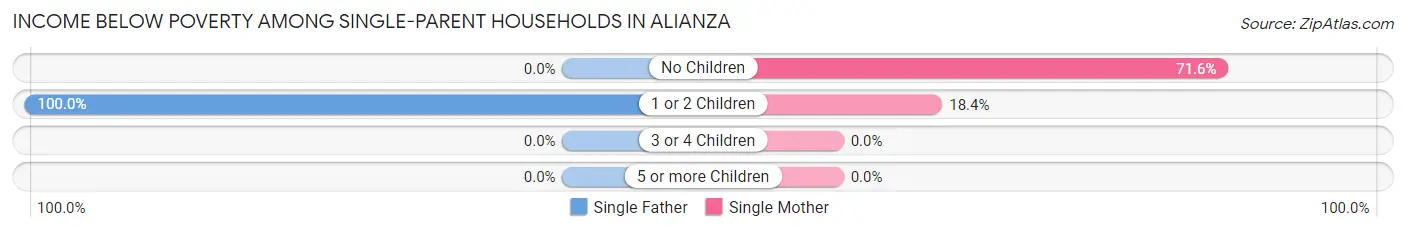
| Children | Single Father | Single Mother |
| No Children | 0 (0.0%) | 48 (71.6%) |
| 1 or 2 Children | 14 (100.0%) | 9 (18.4%) |
| 3 or 4 Children | 0 (0.0%) | 0 (0.0%) |
| 5 or more Children | 0 (0.0%) | 0 (0.0%) |
| Total | 14 (66.7%) | 57 (49.1%) |
Income Below Poverty Among Married-Couple vs Single-Parent Households in Alianza
The poverty data for Alianza shows that 150 of the married-couple family households (33.6%) and 71 of the single-parent households (51.8%) are living below the poverty level. Within the married-couple family households, those with 3 or 4 children have the highest poverty rate, with 26 households (100.0%) falling below the poverty line. Among the single-parent households, those with no children have the highest poverty rate, with 48 household (64.9%) living below poverty.
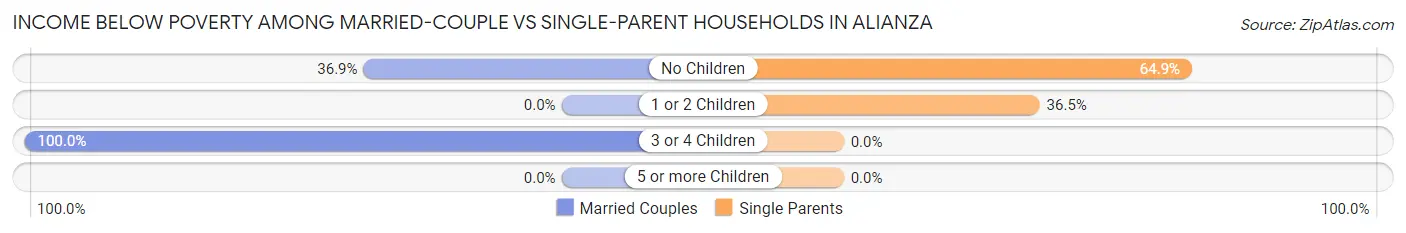
| Children | Married-Couple Families | Single-Parent Households |
| No Children | 124 (36.9%) | 48 (64.9%) |
| 1 or 2 Children | 0 (0.0%) | 23 (36.5%) |
| 3 or 4 Children | 26 (100.0%) | 0 (0.0%) |
| 5 or more Children | 0 (0.0%) | 0 (0.0%) |
| Total | 150 (33.6%) | 71 (51.8%) |
Race in Alianza
The most populous races in Alianza are Hispanic or Latino (2,010 | 100.0%), White / Caucasian (1,702 | 84.7%), and Some other Race (169 | 8.4%).
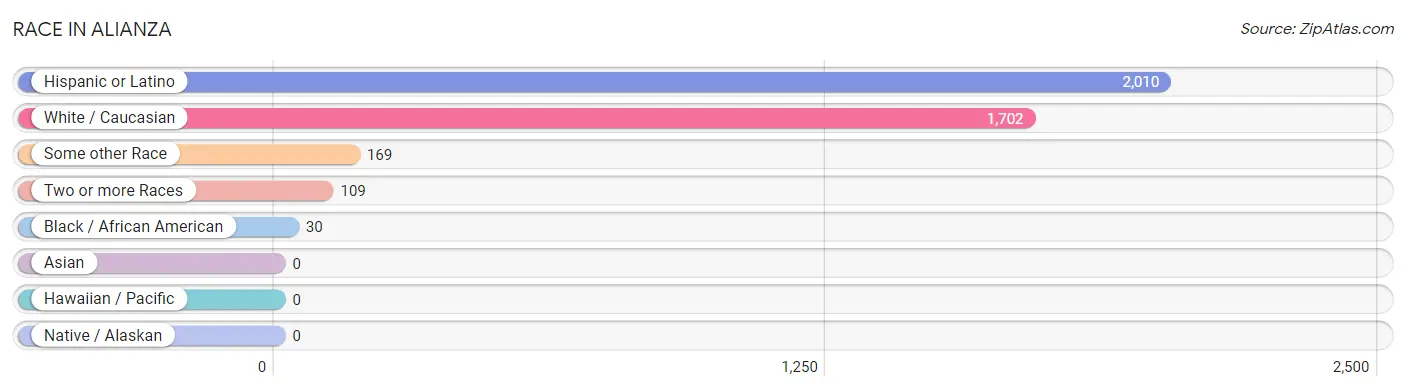
| Race | # Population | % Population |
| Asian | 0 | 0.0% |
| Black / African American | 30 | 1.5% |
| Hawaiian / Pacific | 0 | 0.0% |
| Hispanic or Latino | 2,010 | 100.0% |
| Native / Alaskan | 0 | 0.0% |
| White / Caucasian | 1,702 | 84.7% |
| Two or more Races | 109 | 5.4% |
| Some other Race | 169 | 8.4% |
| Total | 2,010 | 100.0% |
Ancestry in Alianza
The most populous ancestries reported in Alianza are Puerto Rican (2,010 | 100.0%), and American (44 | 2.2%), together accounting for 102.2% of all Alianza residents.
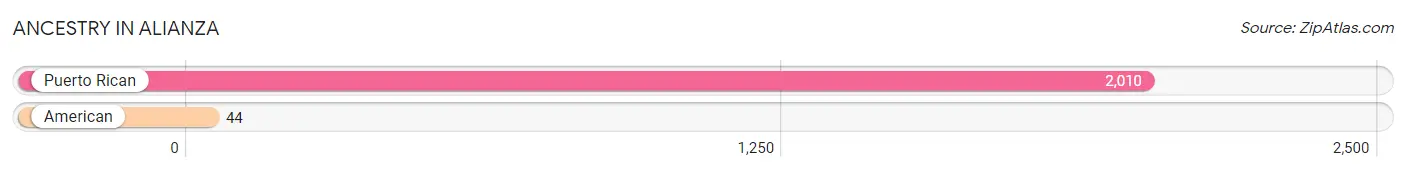
| Ancestry | # Population | % Population |
| American | 44 | 2.2% |
| Puerto Rican | 2,010 | 100.0% | View All 2 Rows |
Immigrants in Alianza

| Immigration Origin | # Population | % Population | View All 0 Rows |
Sex and Age in Alianza
Sex and Age in Alianza
The most populous age groups in Alianza are 65 to 69 Years (126 | 11.1%) for men and 60 to 64 Years (124 | 14.2%) for women.
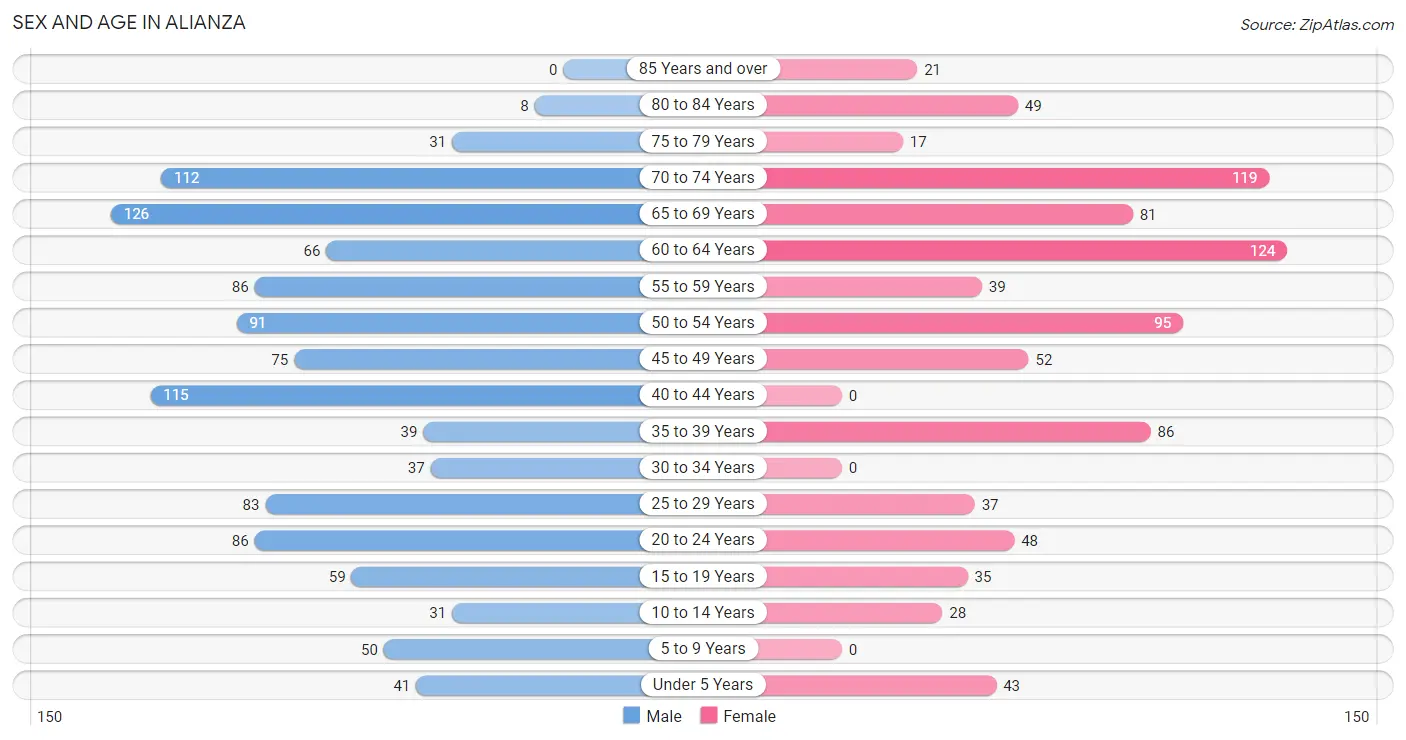
| Age Bracket | Male | Female |
| Under 5 Years | 41 (3.6%) | 43 (4.9%) |
| 5 to 9 Years | 50 (4.4%) | 0 (0.0%) |
| 10 to 14 Years | 31 (2.7%) | 28 (3.2%) |
| 15 to 19 Years | 59 (5.2%) | 35 (4.0%) |
| 20 to 24 Years | 86 (7.6%) | 48 (5.5%) |
| 25 to 29 Years | 83 (7.3%) | 37 (4.2%) |
| 30 to 34 Years | 37 (3.3%) | 0 (0.0%) |
| 35 to 39 Years | 39 (3.4%) | 86 (9.8%) |
| 40 to 44 Years | 115 (10.1%) | 0 (0.0%) |
| 45 to 49 Years | 75 (6.6%) | 52 (5.9%) |
| 50 to 54 Years | 91 (8.0%) | 95 (10.9%) |
| 55 to 59 Years | 86 (7.6%) | 39 (4.5%) |
| 60 to 64 Years | 66 (5.8%) | 124 (14.2%) |
| 65 to 69 Years | 126 (11.1%) | 81 (9.3%) |
| 70 to 74 Years | 112 (9.9%) | 119 (13.6%) |
| 75 to 79 Years | 31 (2.7%) | 17 (1.9%) |
| 80 to 84 Years | 8 (0.7%) | 49 (5.6%) |
| 85 Years and over | 0 (0.0%) | 21 (2.4%) |
| Total | 1,136 (100.0%) | 874 (100.0%) |
Families and Households in Alianza
Median Family Size in Alianza
The median family size in Alianza is 2.93 persons per family, with single male/father families (21 | 3.6%) accounting for the largest median family size of 5.05 persons per family. On the other hand, married-couple families (446 | 76.5%) represent the smallest median family size with 2.73 persons per family.
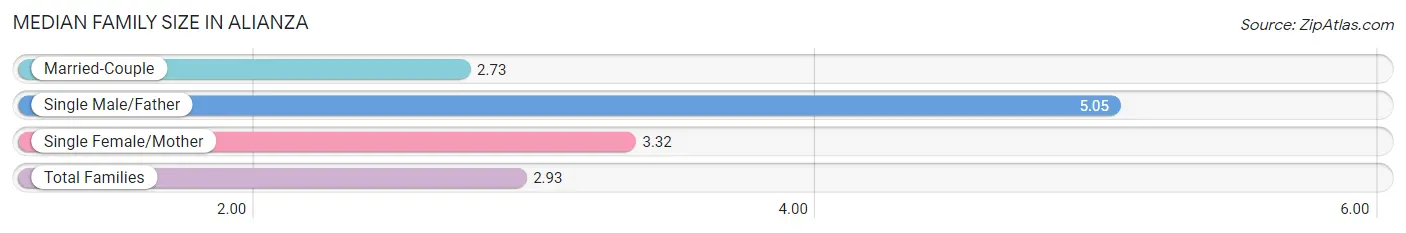
| Family Type | # Families | Family Size |
| Married-Couple | 446 (76.5%) | 2.73 |
| Single Male/Father | 21 (3.6%) | 5.05 |
| Single Female/Mother | 116 (19.9%) | 3.32 |
| Total Families | 583 (100.0%) | 2.93 |
Median Household Size in Alianza
The median household size in Alianza is 2.38 persons per household, with single male/father households (21 | 2.5%) accounting for the largest median household size of 5.57 persons per household. non-family households (252 | 30.2%) represent the smallest median household size with 1.08 persons per household.
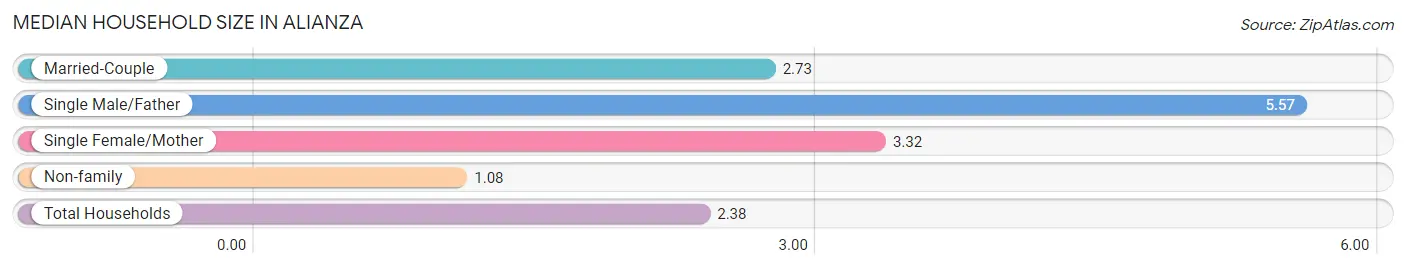
| Household Type | # Households | Household Size |
| Married-Couple | 446 (53.4%) | 2.73 |
| Single Male/Father | 21 (2.5%) | 5.57 |
| Single Female/Mother | 116 (13.9%) | 3.32 |
| Non-family | 252 (30.2%) | 1.08 |
| Total Households | 835 (100.0%) | 2.38 |
Household Size by Marriage Status in Alianza
Out of a total of 835 households in Alianza, 583 (69.8%) are family households, while 252 (30.2%) are nonfamily households. The most numerous type of family households are 2-person households, comprising 338, and the most common type of nonfamily households are 1-person households, comprising 229.
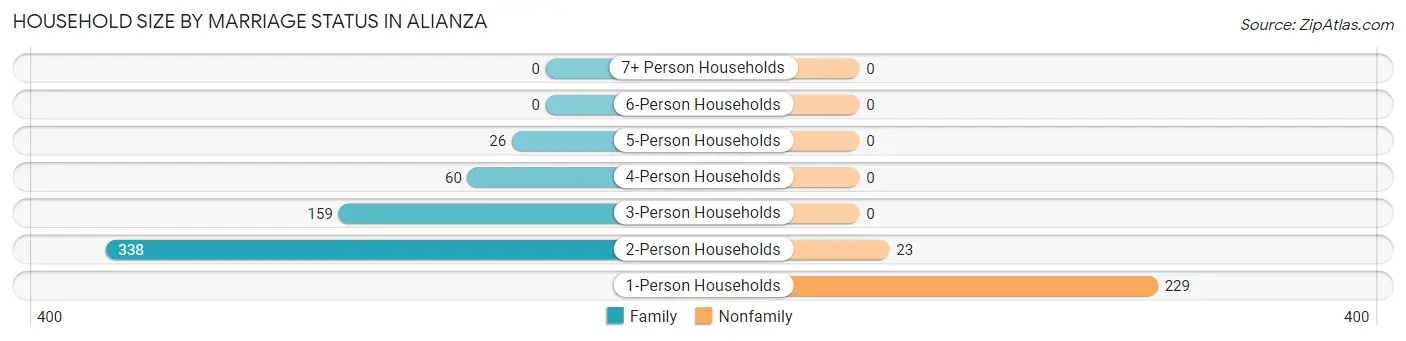
| Household Size | Family Households | Nonfamily Households |
| 1-Person Households | - | 229 (27.4%) |
| 2-Person Households | 338 (40.5%) | 23 (2.8%) |
| 3-Person Households | 159 (19.0%) | 0 (0.0%) |
| 4-Person Households | 60 (7.2%) | 0 (0.0%) |
| 5-Person Households | 26 (3.1%) | 0 (0.0%) |
| 6-Person Households | 0 (0.0%) | 0 (0.0%) |
| 7+ Person Households | 0 (0.0%) | 0 (0.0%) |
| Total | 583 (69.8%) | 252 (30.2%) |
Female Fertility in Alianza
Fertility by Age in Alianza
Average fertility rate in Alianza is 101.0 births per 1,000 women. Women in the age bracket of 35 to 50 years have the highest fertility rate with 188.0 births per 1,000 women. Women in the age bracket of 35 to 50 years acount for 100.0% of all women with births.
| Age Bracket | Women with Births | Births / 1,000 Women |
| 15 to 19 years | 0 (0.0%) | 0.0 |
| 20 to 34 years | 0 (0.0%) | 0.0 |
| 35 to 50 years | 26 (100.0%) | 188.0 |
| Total | 26 (100.0%) | 101.0 |
Fertility by Age by Marriage Status in Alianza
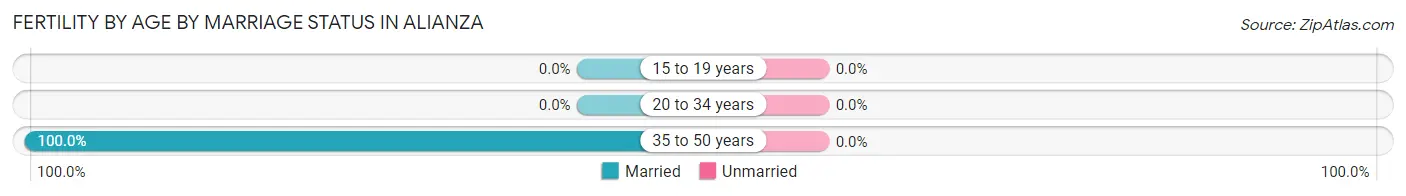
| Age Bracket | Married | Unmarried |
| 15 to 19 years | 0 (0.0%) | 0 (0.0%) |
| 20 to 34 years | 0 (0.0%) | 0 (0.0%) |
| 35 to 50 years | 26 (100.0%) | 0 (0.0%) |
| Total | 26 (100.0%) | 0 (0.0%) |
Fertility by Education in Alianza
| Educational Attainment | Women with Births | Births / 1,000 Women |
| Less than High School | 0 (0.0%) | 0.0 |
| High School Diploma | 0 (0.0%) | 0.0 |
| College or Associate's Degree | 0 (0.0%) | 0.0 |
| Bachelor's Degree | 26 (100.0%) | 342.0 |
| Graduate Degree | 0 (0.0%) | 0.0 |
| Total | 26 (100.0%) | 101.0 |
Fertility by Education by Marriage Status in Alianza
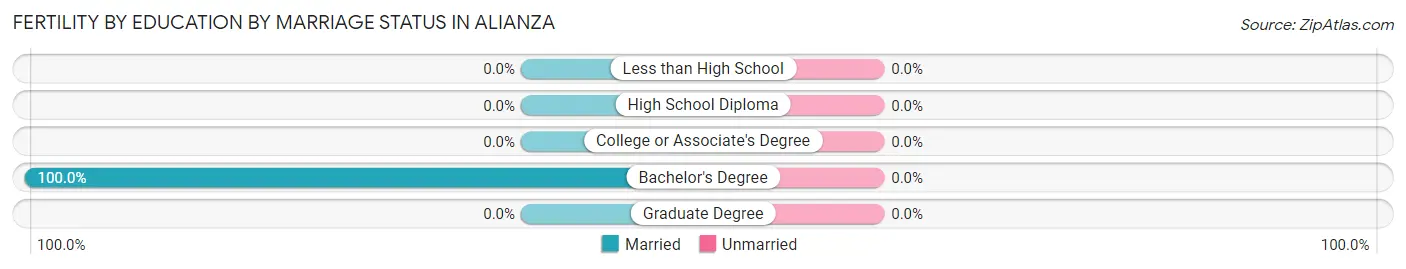
| Educational Attainment | Married | Unmarried |
| Less than High School | 0 (0.0%) | 0 (0.0%) |
| High School Diploma | 0 (0.0%) | 0 (0.0%) |
| College or Associate's Degree | 0 (0.0%) | 0 (0.0%) |
| Bachelor's Degree | 26 (100.0%) | 0 (0.0%) |
| Graduate Degree | 0 (0.0%) | 0 (0.0%) |
| Total | 26 (100.0%) | 0 (0.0%) |
Employment Characteristics in Alianza
Employment by Class of Employer in Alianza
Among the 556 employed individuals in Alianza, private company employees (316 | 56.8%), self-employed (not incorporated) (127 | 22.8%), and state government employees (51 | 9.2%) make up the most common classes of employment.
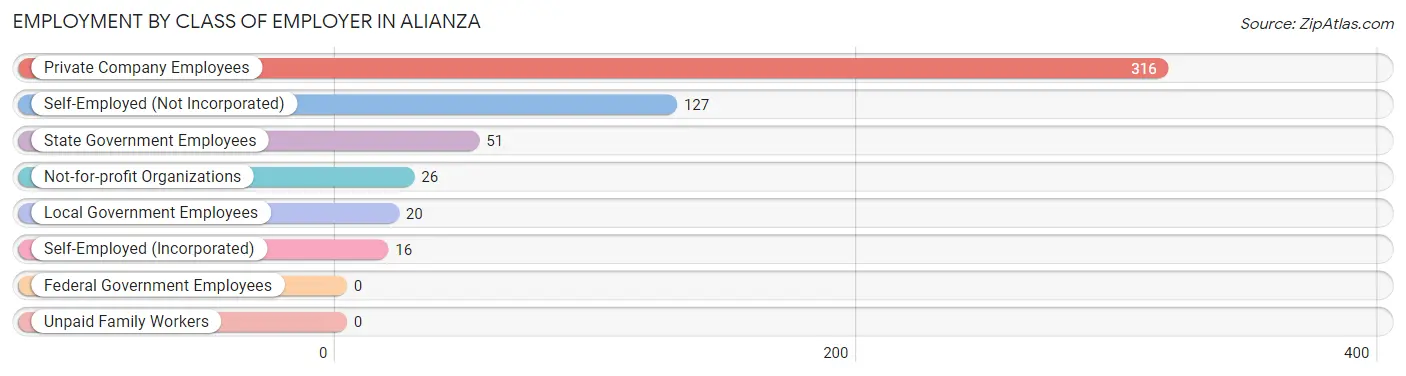
| Employer Class | # Employees | % Employees |
| Private Company Employees | 316 | 56.8% |
| Self-Employed (Incorporated) | 16 | 2.9% |
| Self-Employed (Not Incorporated) | 127 | 22.8% |
| Not-for-profit Organizations | 26 | 4.7% |
| Local Government Employees | 20 | 3.6% |
| State Government Employees | 51 | 9.2% |
| Federal Government Employees | 0 | 0.0% |
| Unpaid Family Workers | 0 | 0.0% |
| Total | 556 | 100.0% |
Employment Status by Age in Alianza
According to the labor force statistics for Alianza, out of the total population over 16 years of age (1,782), 32.4% or 577 individuals are in the labor force, with 3.8% or 22 of them unemployed. The age group with the highest labor force participation rate is 30 to 34 years, with 100.0% or 37 individuals in the labor force. Within the labor force, the 20 to 24 years age range has the highest percentage of unemployed individuals, with 55.0% or 22 of them being unemployed.
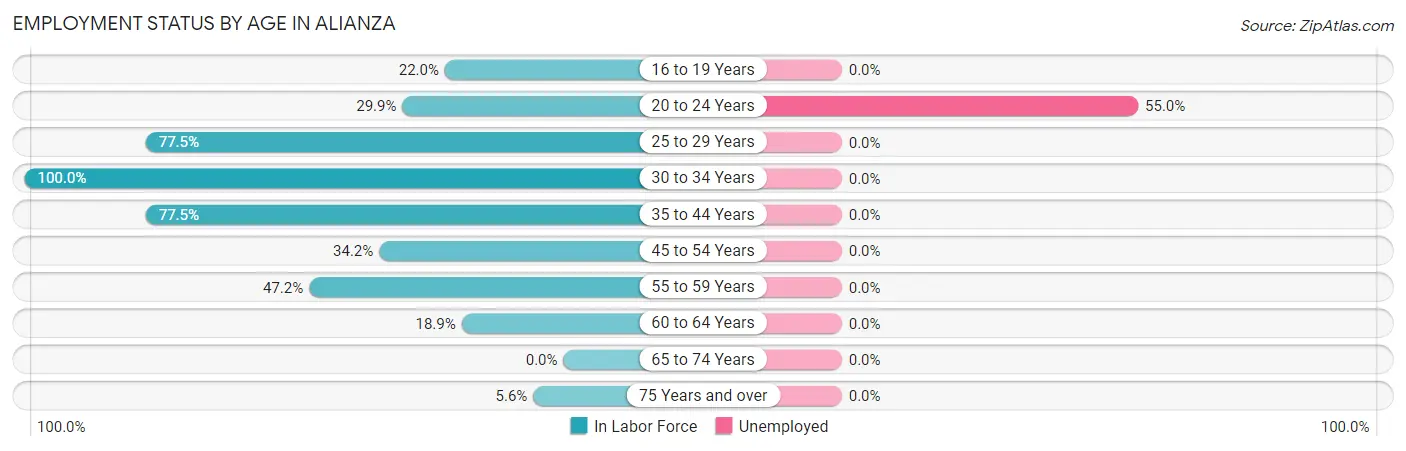
| Age Bracket | In Labor Force | Unemployed |
| 16 to 19 Years | 13 (22.0%) | 0 (0.0%) |
| 20 to 24 Years | 40 (29.9%) | 22 (55.0%) |
| 25 to 29 Years | 93 (77.5%) | 0 (0.0%) |
| 30 to 34 Years | 37 (100.0%) | 0 (0.0%) |
| 35 to 44 Years | 186 (77.5%) | 0 (0.0%) |
| 45 to 54 Years | 107 (34.2%) | 0 (0.0%) |
| 55 to 59 Years | 59 (47.2%) | 0 (0.0%) |
| 60 to 64 Years | 36 (18.9%) | 0 (0.0%) |
| 65 to 74 Years | 0 (0.0%) | 0 (0.0%) |
| 75 Years and over | 7 (5.6%) | 0 (0.0%) |
| Total | 577 (32.4%) | 22 (3.8%) |
Employment Status by Educational Attainment in Alianza
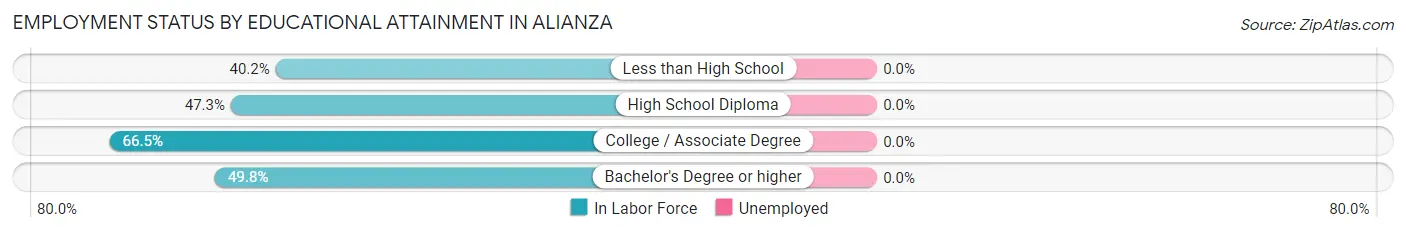
| Educational Attainment | In Labor Force | Unemployed |
| Less than High School | 101 (40.2%) | 0 (0.0%) |
| High School Diploma | 131 (47.3%) | 0 (0.0%) |
| College / Associate Degree | 153 (66.5%) | 0 (0.0%) |
| Bachelor's Degree or higher | 133 (49.8%) | 0 (0.0%) |
| Total | 518 (50.5%) | 0 (0.0%) |
Employment Occupations by Sex in Alianza
Management, Business, Science and Arts Occupations
The most common Management, Business, Science and Arts occupations in Alianza are Management (63 | 11.3%), Community & Social Service (41 | 7.4%), Health Diagnosing & Treating (27 | 4.9%), Education Instruction & Library (26 | 4.7%), and Education, Arts & Media (15 | 2.7%).
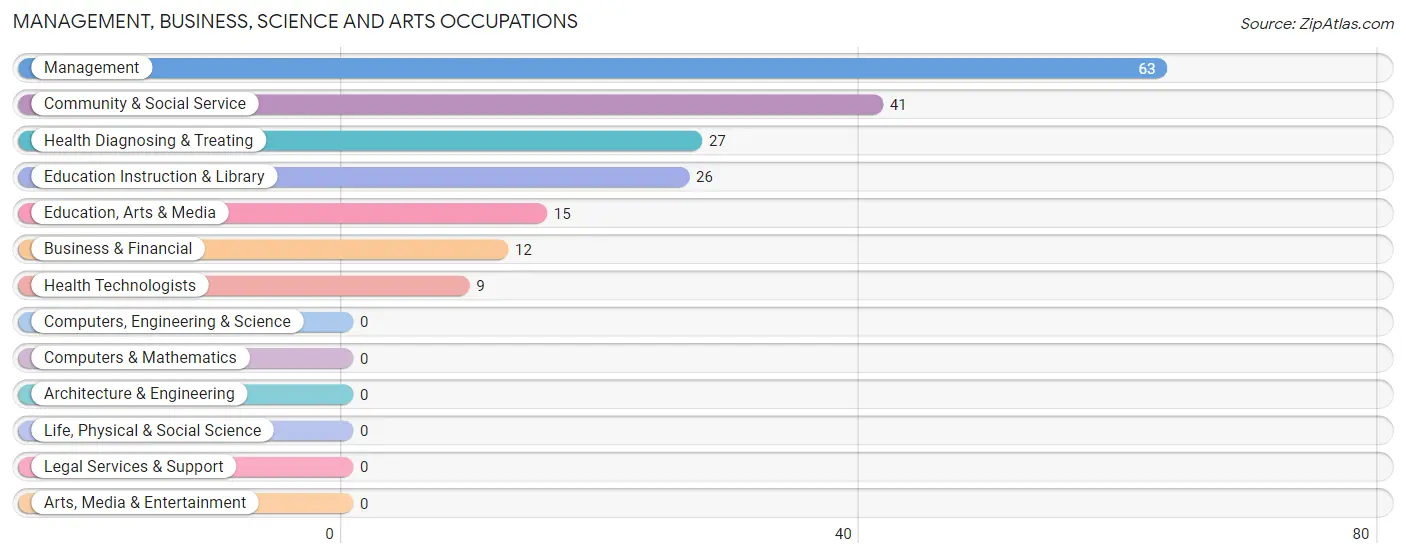
Management, Business, Science and Arts Occupations by Sex
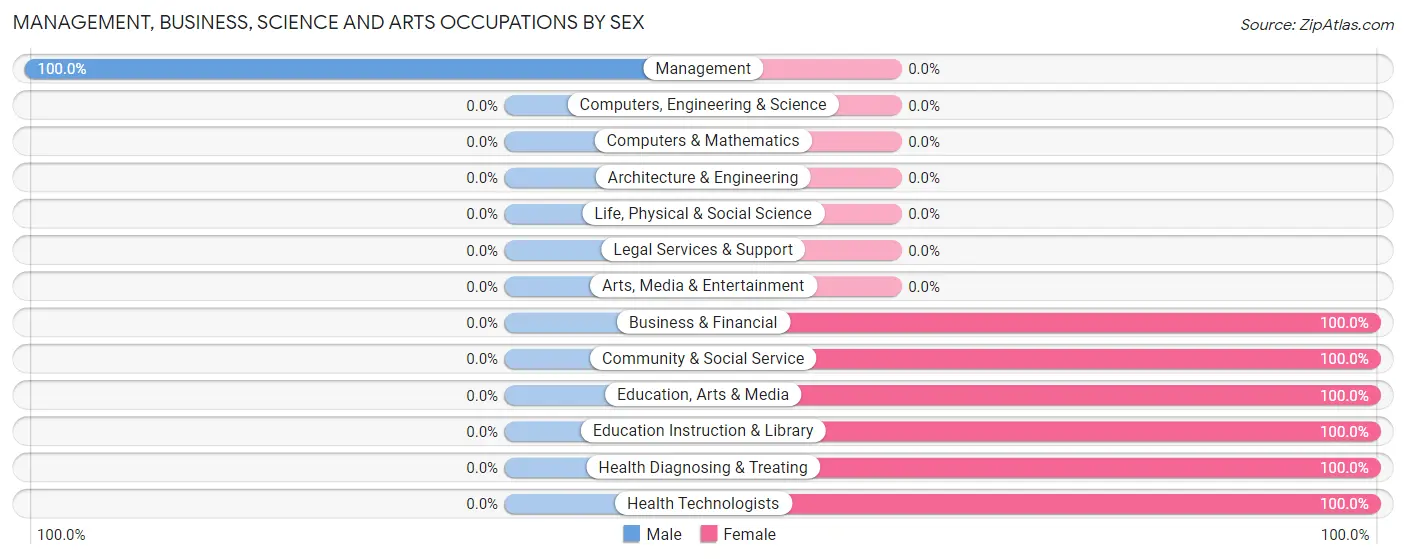
| Occupation | Male | Female |
| Management | 63 (100.0%) | 0 (0.0%) |
| Business & Financial | 0 (0.0%) | 12 (100.0%) |
| Computers, Engineering & Science | 0 (0.0%) | 0 (0.0%) |
| Computers & Mathematics | 0 (0.0%) | 0 (0.0%) |
| Architecture & Engineering | 0 (0.0%) | 0 (0.0%) |
| Life, Physical & Social Science | 0 (0.0%) | 0 (0.0%) |
| Community & Social Service | 0 (0.0%) | 41 (100.0%) |
| Education, Arts & Media | 0 (0.0%) | 15 (100.0%) |
| Legal Services & Support | 0 (0.0%) | 0 (0.0%) |
| Education Instruction & Library | 0 (0.0%) | 26 (100.0%) |
| Arts, Media & Entertainment | 0 (0.0%) | 0 (0.0%) |
| Health Diagnosing & Treating | 0 (0.0%) | 27 (100.0%) |
| Health Technologists | 0 (0.0%) | 9 (100.0%) |
| Total (Category) | 63 (44.1%) | 80 (55.9%) |
| Total (Overall) | 407 (73.2%) | 149 (26.8%) |
Services Occupations
The most common Services occupations in Alianza are Security & Protection (53 | 9.5%), Firefighting & Prevention (27 | 4.9%), Cleaning & Maintenance (27 | 4.9%), and Law Enforcement (26 | 4.7%).
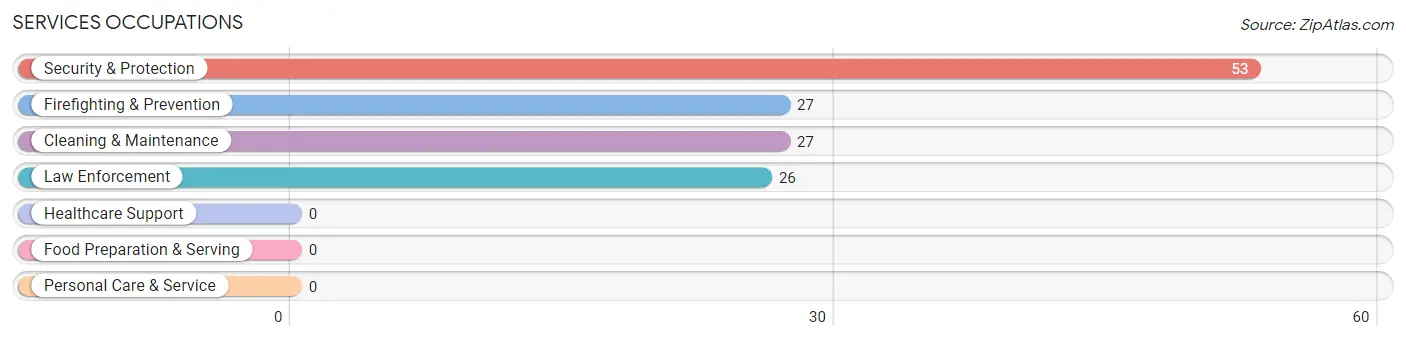
Services Occupations by Sex
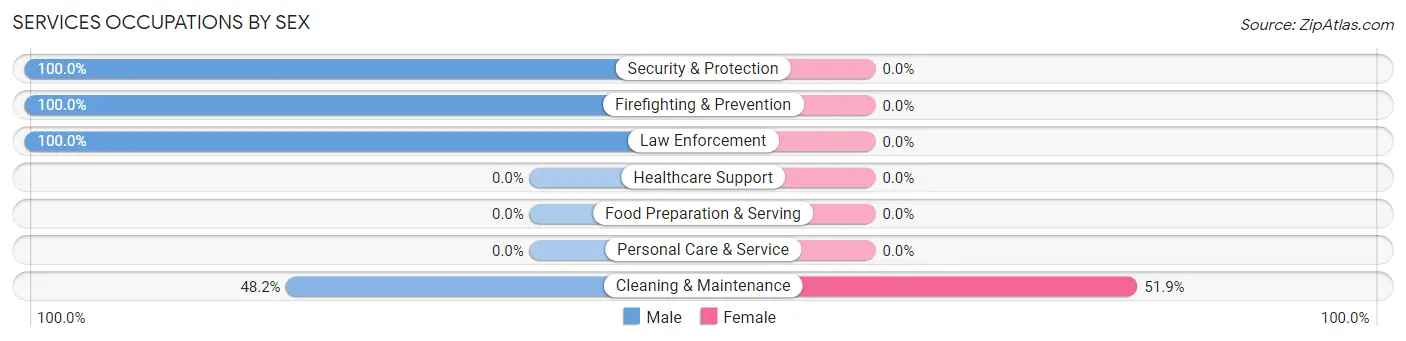
| Occupation | Male | Female |
| Healthcare Support | 0 (0.0%) | 0 (0.0%) |
| Security & Protection | 53 (100.0%) | 0 (0.0%) |
| Firefighting & Prevention | 27 (100.0%) | 0 (0.0%) |
| Law Enforcement | 26 (100.0%) | 0 (0.0%) |
| Food Preparation & Serving | 0 (0.0%) | 0 (0.0%) |
| Cleaning & Maintenance | 13 (48.1%) | 14 (51.8%) |
| Personal Care & Service | 0 (0.0%) | 0 (0.0%) |
| Total (Category) | 66 (82.5%) | 14 (17.5%) |
| Total (Overall) | 407 (73.2%) | 149 (26.8%) |
Sales and Office Occupations
The most common Sales and Office occupations in Alianza are Sales & Related (177 | 31.8%), and Office & Administration (60 | 10.8%).
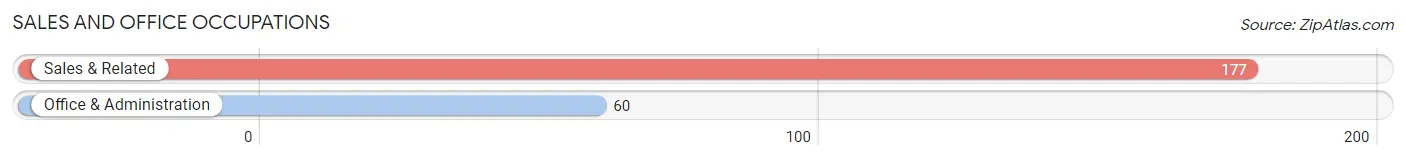
Sales and Office Occupations by Sex
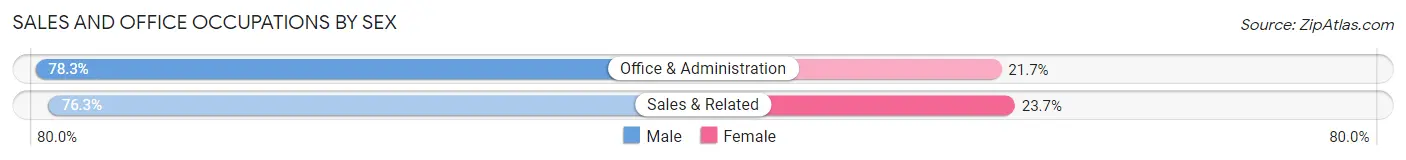
| Occupation | Male | Female |
| Sales & Related | 135 (76.3%) | 42 (23.7%) |
| Office & Administration | 47 (78.3%) | 13 (21.7%) |
| Total (Category) | 182 (76.8%) | 55 (23.2%) |
| Total (Overall) | 407 (73.2%) | 149 (26.8%) |
Natural Resources, Construction and Maintenance Occupations
The most common Natural Resources, Construction and Maintenance occupations in Alianza are , and Construction & Extraction (73 | 13.1%).
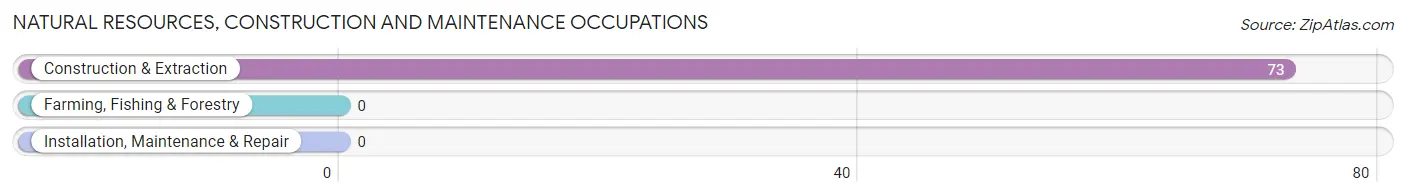
Natural Resources, Construction and Maintenance Occupations by Sex
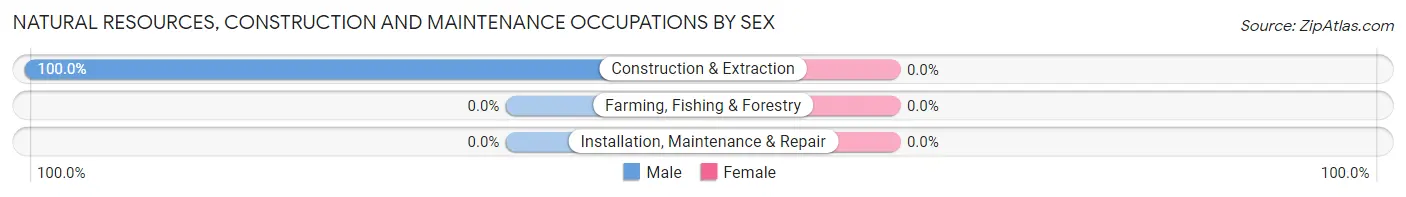
| Occupation | Male | Female |
| Farming, Fishing & Forestry | 0 (0.0%) | 0 (0.0%) |
| Construction & Extraction | 73 (100.0%) | 0 (0.0%) |
| Installation, Maintenance & Repair | 0 (0.0%) | 0 (0.0%) |
| Total (Category) | 73 (100.0%) | 0 (0.0%) |
| Total (Overall) | 407 (73.2%) | 149 (26.8%) |
Production, Transportation and Moving Occupations
The most common Production, Transportation and Moving occupations in Alianza are Material Moving (12 | 2.2%), and Production (11 | 2.0%).
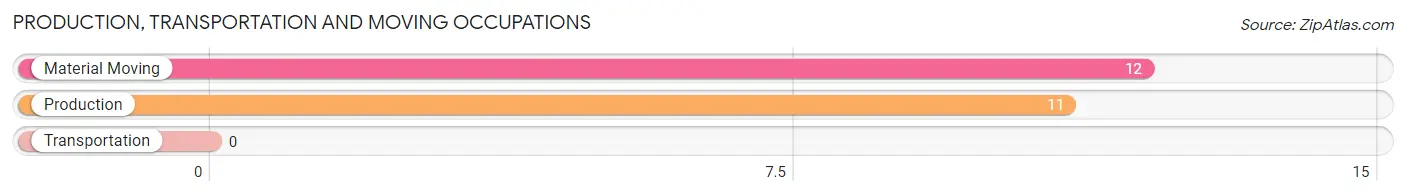
Production, Transportation and Moving Occupations by Sex
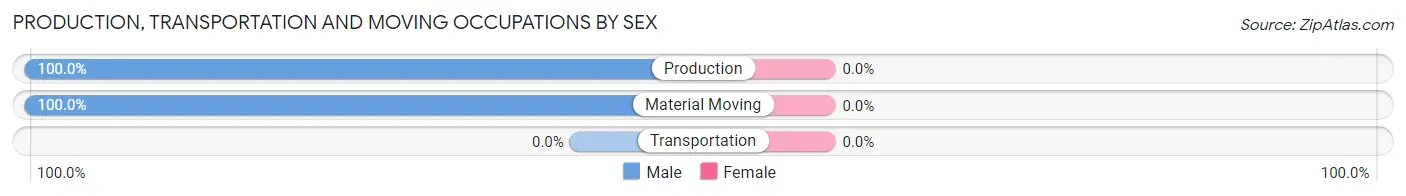
| Occupation | Male | Female |
| Production | 11 (100.0%) | 0 (0.0%) |
| Transportation | 0 (0.0%) | 0 (0.0%) |
| Material Moving | 12 (100.0%) | 0 (0.0%) |
| Total (Category) | 23 (100.0%) | 0 (0.0%) |
| Total (Overall) | 407 (73.2%) | 149 (26.8%) |
Employment Industries by Sex in Alianza
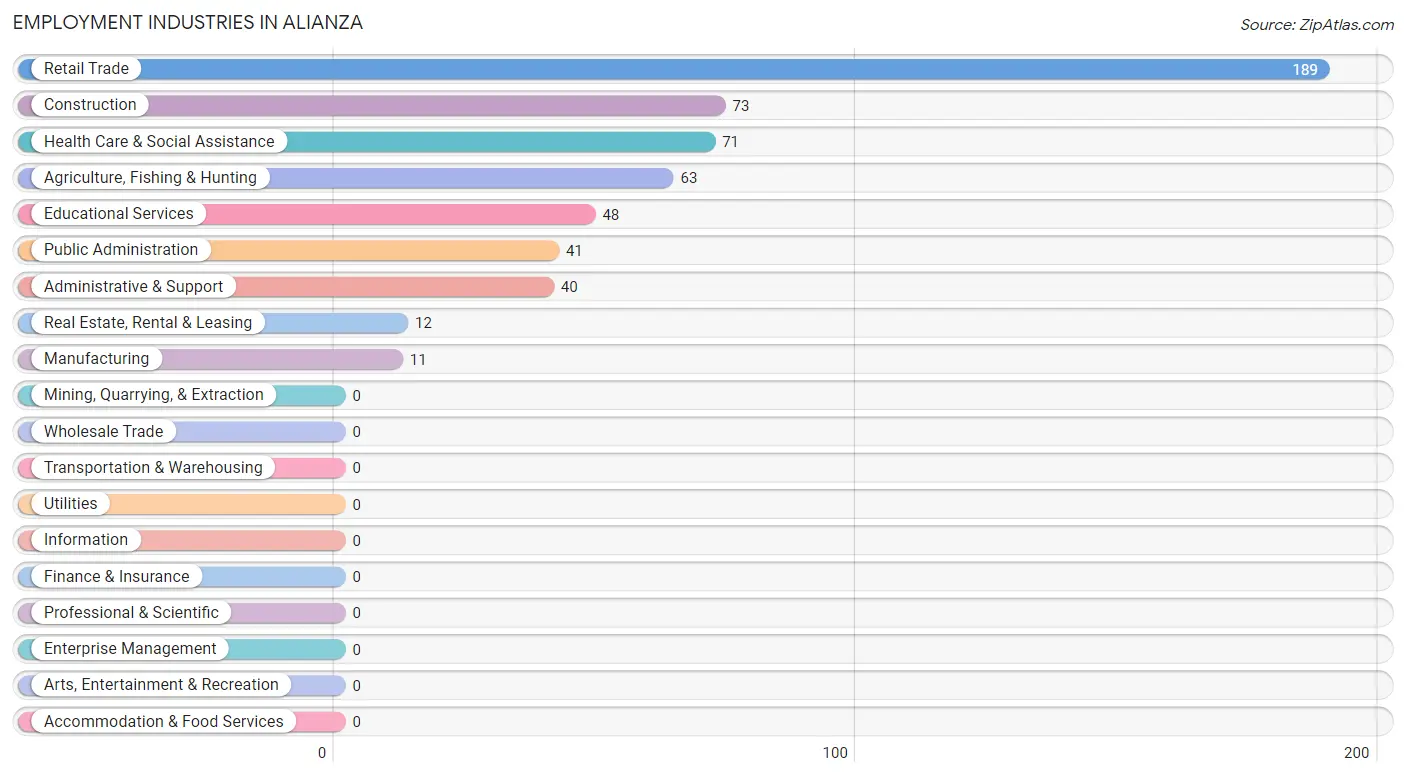
Employment Industries in Alianza
The major employment industries in Alianza include Retail Trade (189 | 34.0%), Construction (73 | 13.1%), Health Care & Social Assistance (71 | 12.8%), Agriculture, Fishing & Hunting (63 | 11.3%), and Educational Services (48 | 8.6%).
Employment Industries by Sex in Alianza
The Alianza industries that see more men than women are Agriculture, Fishing & Hunting (100.0%), Construction (100.0%), and Manufacturing (100.0%), whereas the industries that tend to have a higher number of women are Educational Services (100.0%), Health Care & Social Assistance (45.1%), and Public Administration (36.6%).
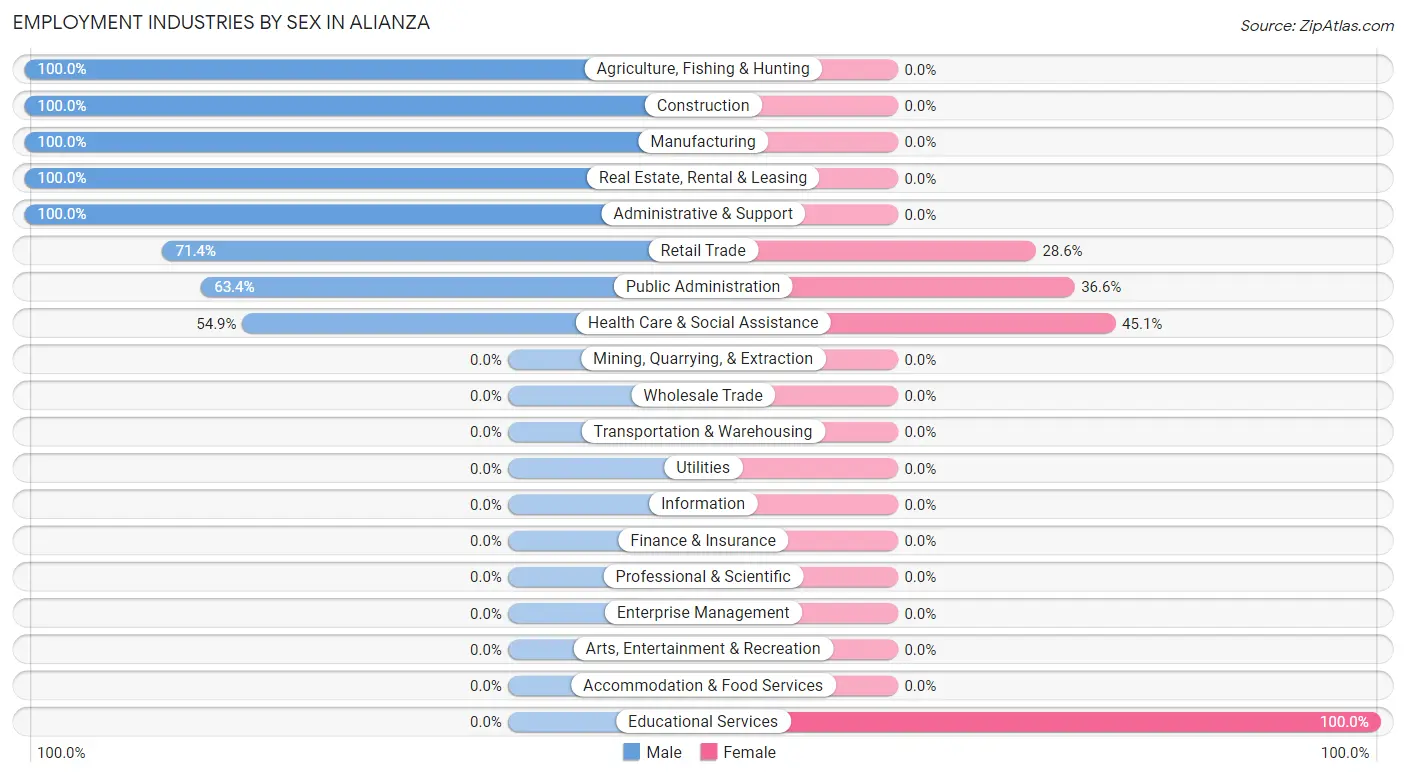
| Industry | Male | Female |
| Agriculture, Fishing & Hunting | 63 (100.0%) | 0 (0.0%) |
| Mining, Quarrying, & Extraction | 0 (0.0%) | 0 (0.0%) |
| Construction | 73 (100.0%) | 0 (0.0%) |
| Manufacturing | 11 (100.0%) | 0 (0.0%) |
| Wholesale Trade | 0 (0.0%) | 0 (0.0%) |
| Retail Trade | 135 (71.4%) | 54 (28.6%) |
| Transportation & Warehousing | 0 (0.0%) | 0 (0.0%) |
| Utilities | 0 (0.0%) | 0 (0.0%) |
| Information | 0 (0.0%) | 0 (0.0%) |
| Finance & Insurance | 0 (0.0%) | 0 (0.0%) |
| Real Estate, Rental & Leasing | 12 (100.0%) | 0 (0.0%) |
| Professional & Scientific | 0 (0.0%) | 0 (0.0%) |
| Enterprise Management | 0 (0.0%) | 0 (0.0%) |
| Administrative & Support | 40 (100.0%) | 0 (0.0%) |
| Educational Services | 0 (0.0%) | 48 (100.0%) |
| Health Care & Social Assistance | 39 (54.9%) | 32 (45.1%) |
| Arts, Entertainment & Recreation | 0 (0.0%) | 0 (0.0%) |
| Accommodation & Food Services | 0 (0.0%) | 0 (0.0%) |
| Public Administration | 26 (63.4%) | 15 (36.6%) |
| Total | 407 (73.2%) | 149 (26.8%) |
Education in Alianza
School Enrollment in Alianza
The most common levels of schooling among the 225 students in Alianza are middle school (101 | 44.9%), college / undergraduate (53 | 23.6%), and high school (28 | 12.4%).
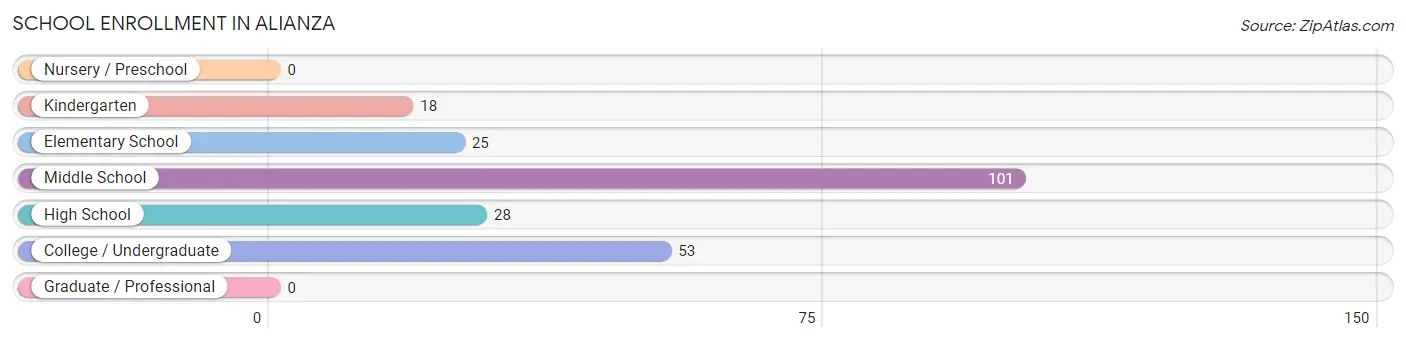
| School Level | # Students | % Students |
| Nursery / Preschool | 0 | 0.0% |
| Kindergarten | 18 | 8.0% |
| Elementary School | 25 | 11.1% |
| Middle School | 101 | 44.9% |
| High School | 28 | 12.4% |
| College / Undergraduate | 53 | 23.6% |
| Graduate / Professional | 0 | 0.0% |
| Total | 225 | 100.0% |
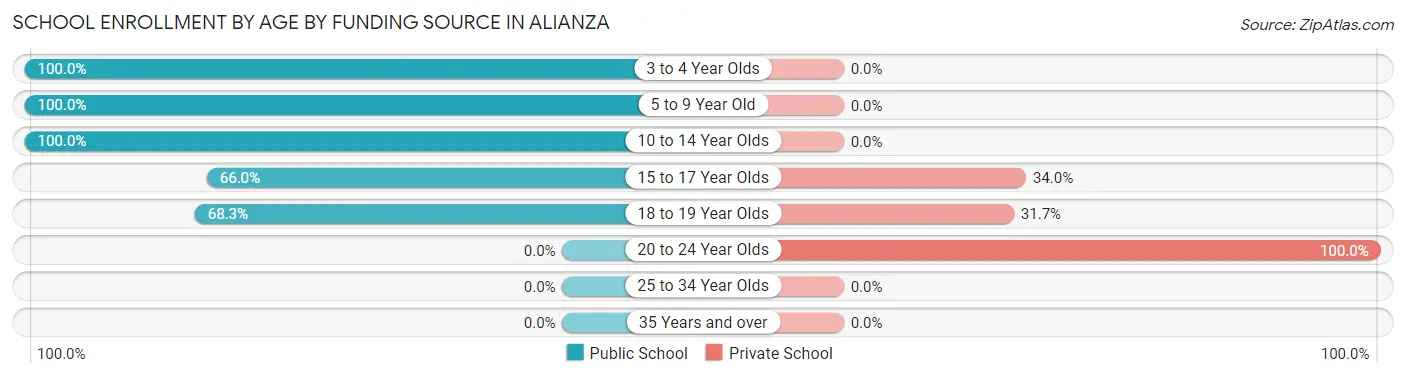
School Enrollment by Age by Funding Source in Alianza
Out of a total of 225 students who are enrolled in schools in Alianza, 53 (23.6%) attend a private institution, while the remaining 172 (76.4%) are enrolled in public schools. The age group of 20 to 24 year olds has the highest likelihood of being enrolled in private schools, with 22 (100.0% in the age bracket) enrolled. Conversely, the age group of 3 to 4 year olds has the lowest likelihood of being enrolled in a private school, with 18 (100.0% in the age bracket) attending a public institution.
| Age Bracket | Public School | Private School |
| 3 to 4 Year Olds | 18 (100.0%) | 0 (0.0%) |
| 5 to 9 Year Old | 50 (100.0%) | 0 (0.0%) |
| 10 to 14 Year Olds | 41 (100.0%) | 0 (0.0%) |
| 15 to 17 Year Olds | 35 (66.0%) | 18 (34.0%) |
| 18 to 19 Year Olds | 28 (68.3%) | 13 (31.7%) |
| 20 to 24 Year Olds | 0 (0.0%) | 22 (100.0%) |
| 25 to 34 Year Olds | 0 (0.0%) | 0 (0.0%) |
| 35 Years and over | 0 (0.0%) | 0 (0.0%) |
| Total | 172 (76.4%) | 53 (23.6%) |
Educational Attainment by Field of Study in Alianza
Business (115 | 39.3%), arts & humanities (62 | 21.2%), education (49 | 16.7%), engineering (27 | 9.2%), and science & technology (27 | 9.2%) are the most common fields of study among 293 individuals in Alianza who have obtained a bachelor's degree or higher.
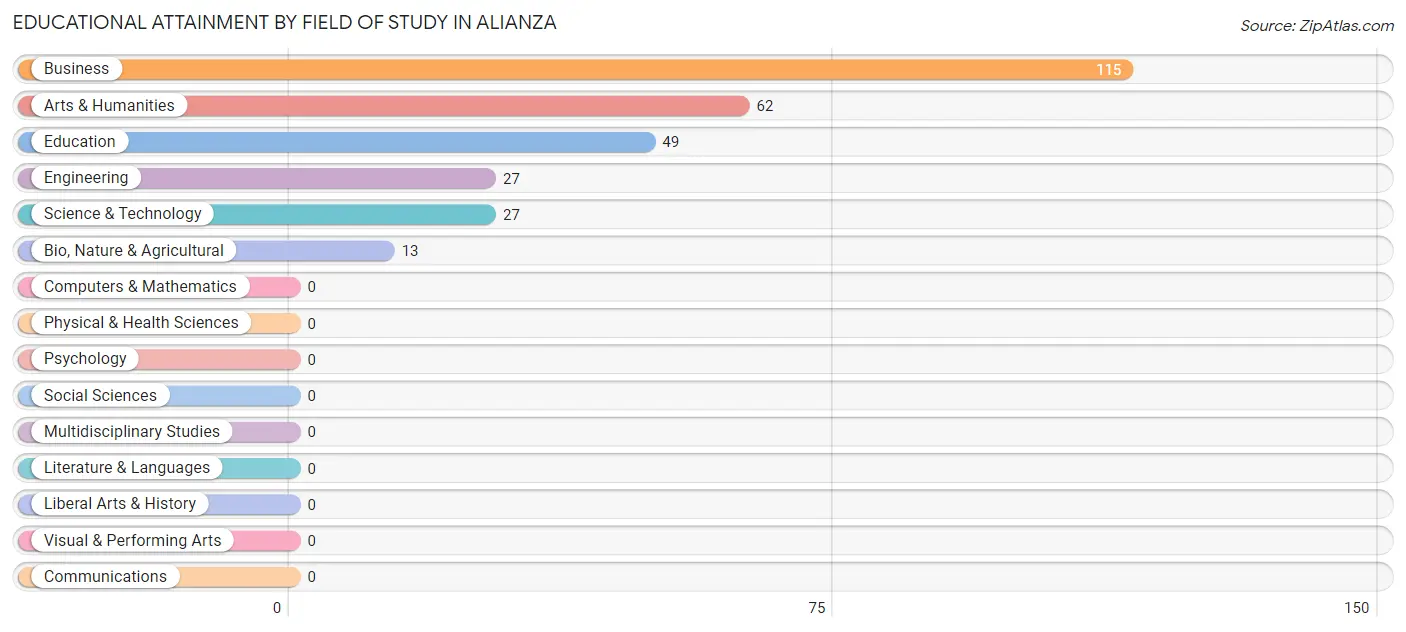
| Field of Study | # Graduates | % Graduates |
| Computers & Mathematics | 0 | 0.0% |
| Bio, Nature & Agricultural | 13 | 4.4% |
| Physical & Health Sciences | 0 | 0.0% |
| Psychology | 0 | 0.0% |
| Social Sciences | 0 | 0.0% |
| Engineering | 27 | 9.2% |
| Multidisciplinary Studies | 0 | 0.0% |
| Science & Technology | 27 | 9.2% |
| Business | 115 | 39.3% |
| Education | 49 | 16.7% |
| Literature & Languages | 0 | 0.0% |
| Liberal Arts & History | 0 | 0.0% |
| Visual & Performing Arts | 0 | 0.0% |
| Communications | 0 | 0.0% |
| Arts & Humanities | 62 | 21.2% |
| Total | 293 | 100.0% |
Transportation & Commute in Alianza
Vehicle Availability by Sex in Alianza
The most prevalent vehicle ownership categories in Alianza are males with 1 vehicle (144, accounting for 35.4%) and females with 1 vehicle (31, making up 96.6%).
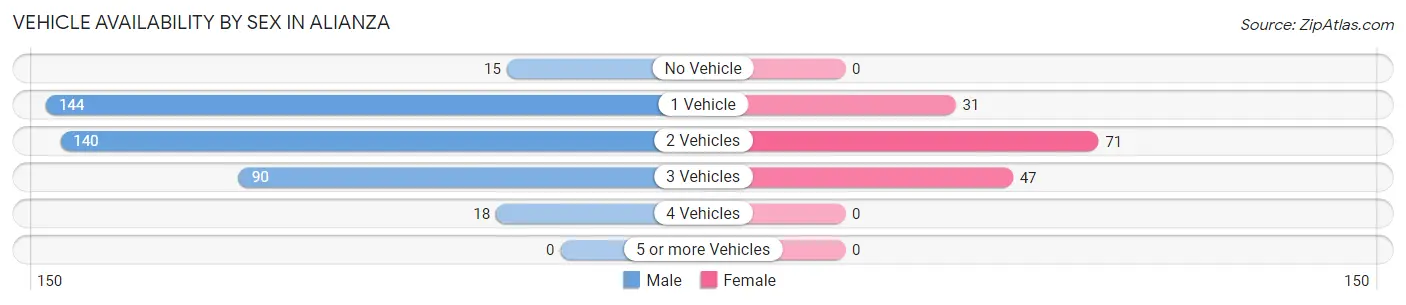
| Vehicles Available | Male | Female |
| No Vehicle | 15 (3.7%) | 0 (0.0%) |
| 1 Vehicle | 144 (35.4%) | 31 (20.8%) |
| 2 Vehicles | 140 (34.4%) | 71 (47.6%) |
| 3 Vehicles | 90 (22.1%) | 47 (31.5%) |
| 4 Vehicles | 18 (4.4%) | 0 (0.0%) |
| 5 or more Vehicles | 0 (0.0%) | 0 (0.0%) |
| Total | 407 (100.0%) | 149 (100.0%) |
Commute Time in Alianza
The most frequently occuring commute durations in Alianza are 20 to 24 minutes (150 commuters, 28.2%), 15 to 19 minutes (126 commuters, 23.7%), and 25 to 29 minutes (91 commuters, 17.1%).
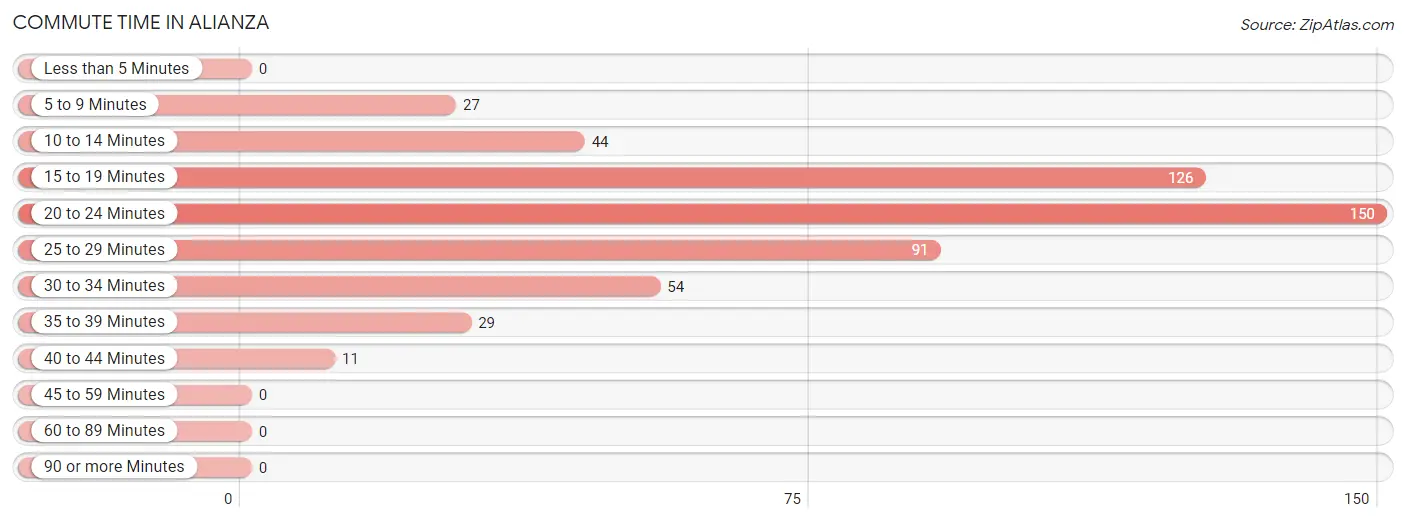
| Commute Time | # Commuters | % Commuters |
| Less than 5 Minutes | 0 | 0.0% |
| 5 to 9 Minutes | 27 | 5.1% |
| 10 to 14 Minutes | 44 | 8.3% |
| 15 to 19 Minutes | 126 | 23.7% |
| 20 to 24 Minutes | 150 | 28.2% |
| 25 to 29 Minutes | 91 | 17.1% |
| 30 to 34 Minutes | 54 | 10.2% |
| 35 to 39 Minutes | 29 | 5.4% |
| 40 to 44 Minutes | 11 | 2.1% |
| 45 to 59 Minutes | 0 | 0.0% |
| 60 to 89 Minutes | 0 | 0.0% |
| 90 or more Minutes | 0 | 0.0% |
Commute Time by Sex in Alianza
The most common commute times in Alianza are 15 to 19 minutes (103 commuters, 26.3%) for males and 20 to 24 minutes (76 commuters, 53.9%) for females.
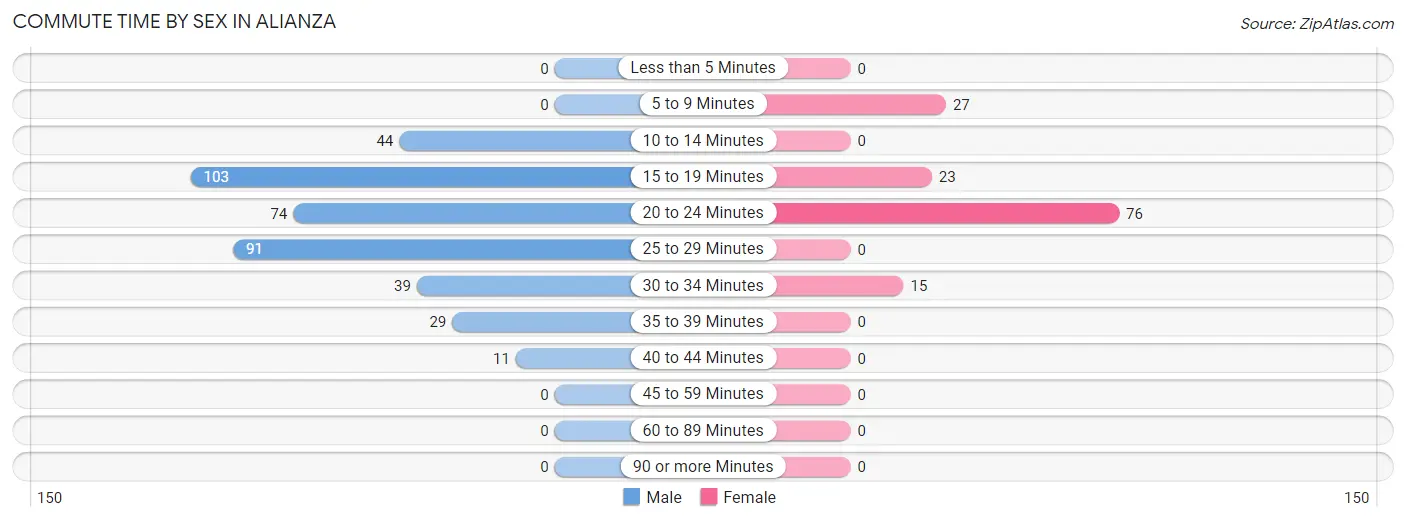
| Commute Time | Male | Female |
| Less than 5 Minutes | 0 (0.0%) | 0 (0.0%) |
| 5 to 9 Minutes | 0 (0.0%) | 27 (19.2%) |
| 10 to 14 Minutes | 44 (11.3%) | 0 (0.0%) |
| 15 to 19 Minutes | 103 (26.3%) | 23 (16.3%) |
| 20 to 24 Minutes | 74 (18.9%) | 76 (53.9%) |
| 25 to 29 Minutes | 91 (23.3%) | 0 (0.0%) |
| 30 to 34 Minutes | 39 (10.0%) | 15 (10.6%) |
| 35 to 39 Minutes | 29 (7.4%) | 0 (0.0%) |
| 40 to 44 Minutes | 11 (2.8%) | 0 (0.0%) |
| 45 to 59 Minutes | 0 (0.0%) | 0 (0.0%) |
| 60 to 89 Minutes | 0 (0.0%) | 0 (0.0%) |
| 90 or more Minutes | 0 (0.0%) | 0 (0.0%) |
Time of Departure to Work by Sex in Alianza
The most frequent times of departure to work in Alianza are 7:00 AM to 7:29 AM (203, 51.9%) for males and 7:00 AM to 7:29 AM (55, 39.0%) for females.
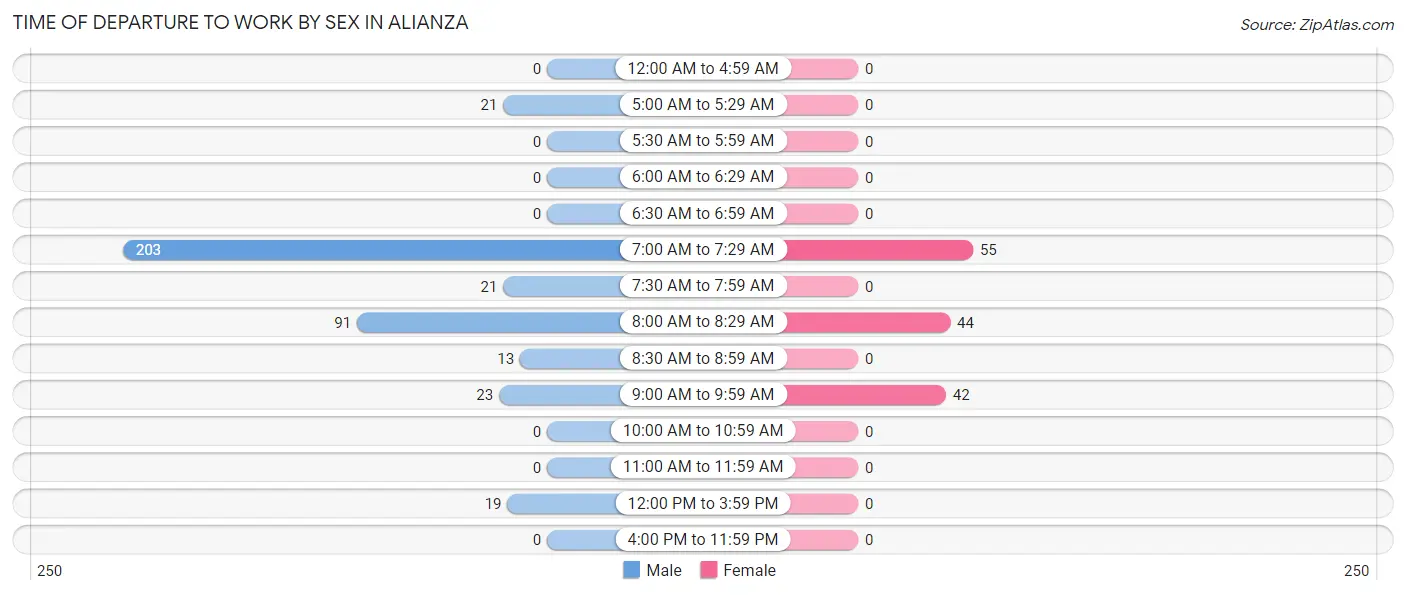
| Time of Departure | Male | Female |
| 12:00 AM to 4:59 AM | 0 (0.0%) | 0 (0.0%) |
| 5:00 AM to 5:29 AM | 21 (5.4%) | 0 (0.0%) |
| 5:30 AM to 5:59 AM | 0 (0.0%) | 0 (0.0%) |
| 6:00 AM to 6:29 AM | 0 (0.0%) | 0 (0.0%) |
| 6:30 AM to 6:59 AM | 0 (0.0%) | 0 (0.0%) |
| 7:00 AM to 7:29 AM | 203 (51.9%) | 55 (39.0%) |
| 7:30 AM to 7:59 AM | 21 (5.4%) | 0 (0.0%) |
| 8:00 AM to 8:29 AM | 91 (23.3%) | 44 (31.2%) |
| 8:30 AM to 8:59 AM | 13 (3.3%) | 0 (0.0%) |
| 9:00 AM to 9:59 AM | 23 (5.9%) | 42 (29.8%) |
| 10:00 AM to 10:59 AM | 0 (0.0%) | 0 (0.0%) |
| 11:00 AM to 11:59 AM | 0 (0.0%) | 0 (0.0%) |
| 12:00 PM to 3:59 PM | 19 (4.9%) | 0 (0.0%) |
| 4:00 PM to 11:59 PM | 0 (0.0%) | 0 (0.0%) |
| Total | 391 (100.0%) | 141 (100.0%) |
Housing Occupancy in Alianza
Occupancy by Ownership in Alianza
Of the total 835 dwellings in Alianza, owner-occupied units account for 688 (82.4%), while renter-occupied units make up 147 (17.6%).
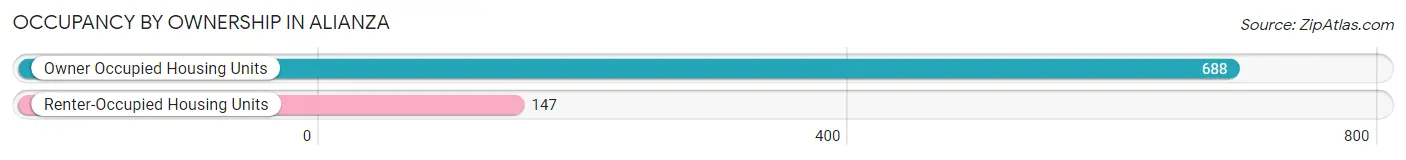
| Occupancy | # Housing Units | % Housing Units |
| Owner Occupied Housing Units | 688 | 82.4% |
| Renter-Occupied Housing Units | 147 | 17.6% |
| Total Occupied Housing Units | 835 | 100.0% |
Occupancy by Household Size in Alianza
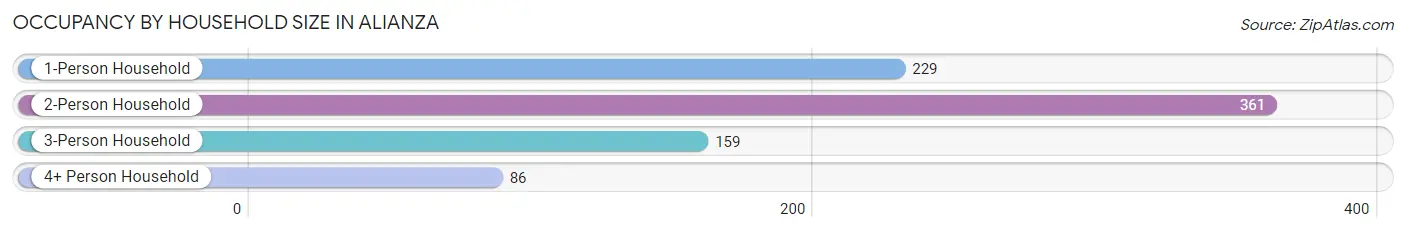
| Household Size | # Housing Units | % Housing Units |
| 1-Person Household | 229 | 27.4% |
| 2-Person Household | 361 | 43.2% |
| 3-Person Household | 159 | 19.0% |
| 4+ Person Household | 86 | 10.3% |
| Total Housing Units | 835 | 100.0% |
Occupancy by Ownership by Household Size in Alianza
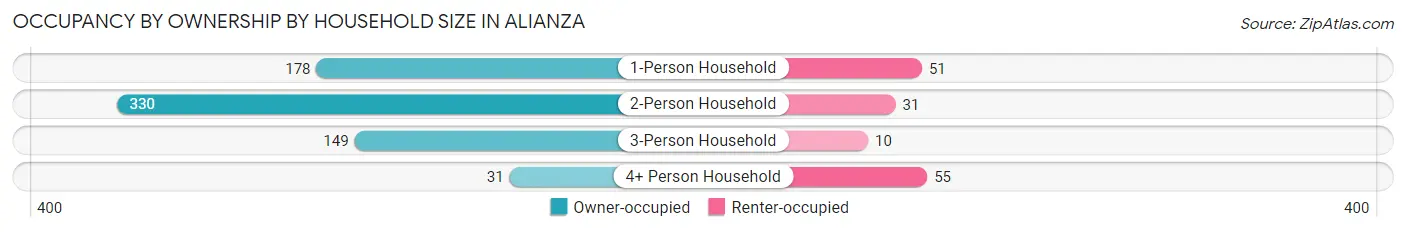
| Household Size | Owner-occupied | Renter-occupied |
| 1-Person Household | 178 (77.7%) | 51 (22.3%) |
| 2-Person Household | 330 (91.4%) | 31 (8.6%) |
| 3-Person Household | 149 (93.7%) | 10 (6.3%) |
| 4+ Person Household | 31 (36.0%) | 55 (63.9%) |
| Total Housing Units | 688 (82.4%) | 147 (17.6%) |
Occupancy by Educational Attainment in Alianza
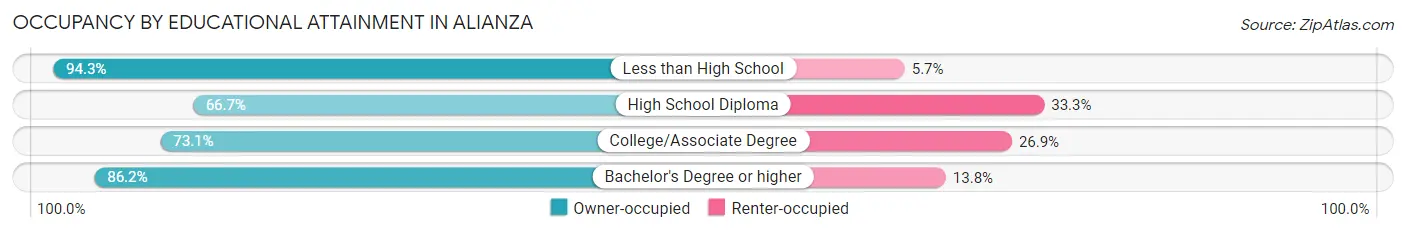
| Household Size | Owner-occupied | Renter-occupied |
| Less than High School | 283 (94.3%) | 17 (5.7%) |
| High School Diploma | 110 (66.7%) | 55 (33.3%) |
| College/Associate Degree | 133 (73.1%) | 49 (26.9%) |
| Bachelor's Degree or higher | 162 (86.2%) | 26 (13.8%) |
Occupancy by Age of Householder in Alianza
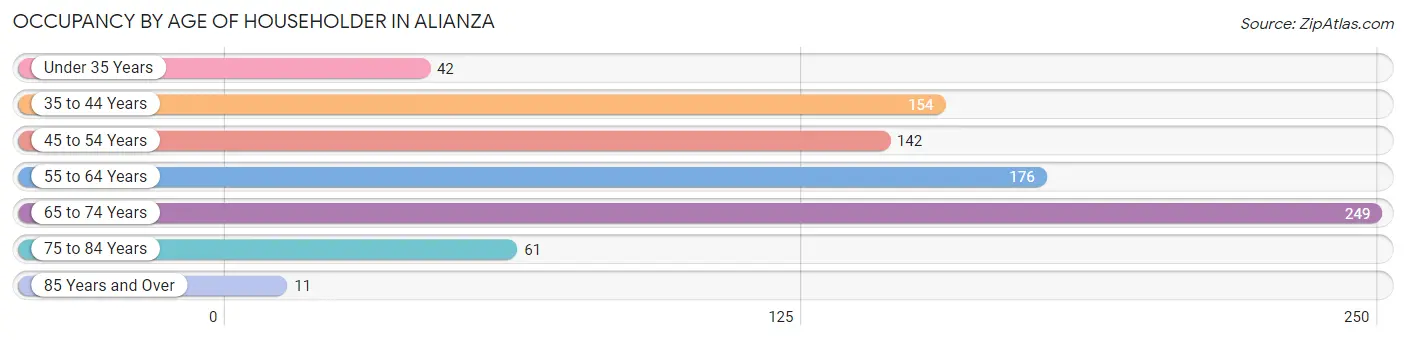
| Age Bracket | # Households | % Households |
| Under 35 Years | 42 | 5.0% |
| 35 to 44 Years | 154 | 18.4% |
| 45 to 54 Years | 142 | 17.0% |
| 55 to 64 Years | 176 | 21.1% |
| 65 to 74 Years | 249 | 29.8% |
| 75 to 84 Years | 61 | 7.3% |
| 85 Years and Over | 11 | 1.3% |
| Total | 835 | 100.0% |
Housing Finances in Alianza
Median Income by Occupancy in Alianza
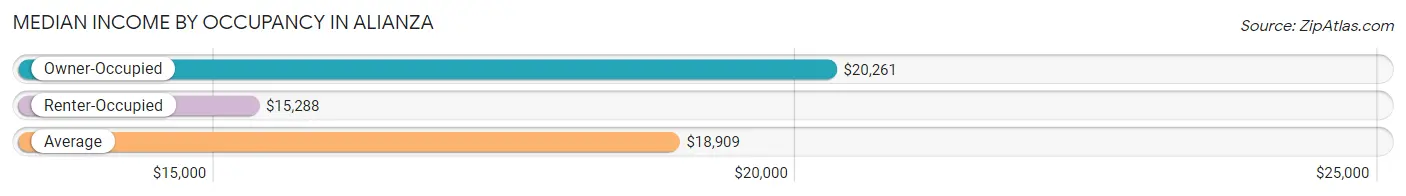
| Occupancy Type | # Households | Median Income |
| Owner-Occupied | 688 (82.4%) | $20,261 |
| Renter-Occupied | 147 (17.6%) | $15,288 |
| Average | 835 (100.0%) | $18,909 |
Occupancy by Householder Income Bracket in Alianza
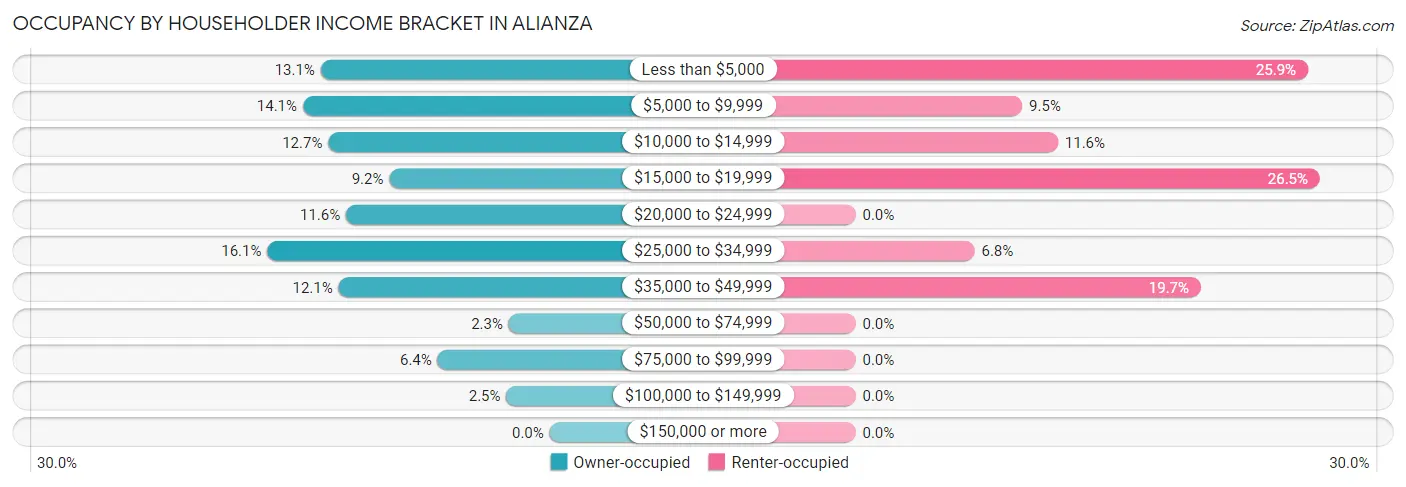
| Income Bracket | Owner-occupied | Renter-occupied |
| Less than $5,000 | 90 (13.1%) | 38 (25.9%) |
| $5,000 to $9,999 | 97 (14.1%) | 14 (9.5%) |
| $10,000 to $14,999 | 87 (12.7%) | 17 (11.6%) |
| $15,000 to $19,999 | 63 (9.2%) | 39 (26.5%) |
| $20,000 to $24,999 | 80 (11.6%) | 0 (0.0%) |
| $25,000 to $34,999 | 111 (16.1%) | 10 (6.8%) |
| $35,000 to $49,999 | 83 (12.1%) | 29 (19.7%) |
| $50,000 to $74,999 | 16 (2.3%) | 0 (0.0%) |
| $75,000 to $99,999 | 44 (6.4%) | 0 (0.0%) |
| $100,000 to $149,999 | 17 (2.5%) | 0 (0.0%) |
| $150,000 or more | 0 (0.0%) | 0 (0.0%) |
| Total | 688 (100.0%) | 147 (100.0%) |
Monthly Housing Cost Tiers in Alianza
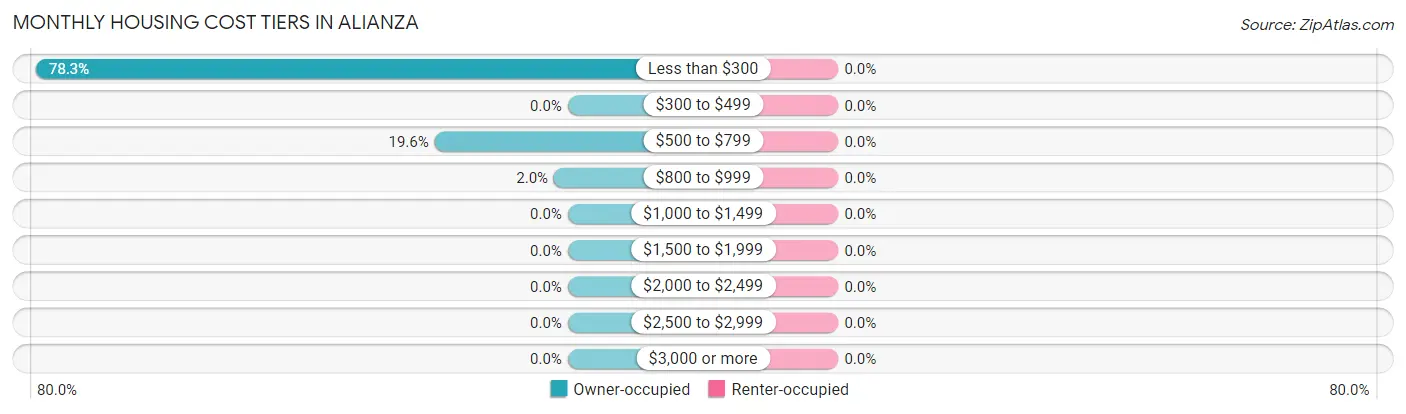
| Monthly Cost | Owner-occupied | Renter-occupied |
| Less than $300 | 539 (78.3%) | 0 (0.0%) |
| $300 to $499 | 0 (0.0%) | 0 (0.0%) |
| $500 to $799 | 135 (19.6%) | 0 (0.0%) |
| $800 to $999 | 14 (2.0%) | 0 (0.0%) |
| $1,000 to $1,499 | 0 (0.0%) | 0 (0.0%) |
| $1,500 to $1,999 | 0 (0.0%) | 0 (0.0%) |
| $2,000 to $2,499 | 0 (0.0%) | 0 (0.0%) |
| $2,500 to $2,999 | 0 (0.0%) | 0 (0.0%) |
| $3,000 or more | 0 (0.0%) | 0 (0.0%) |
| Total | 688 (100.0%) | 147 (100.0%) |
Physical Housing Characteristics in Alianza
Housing Structures in Alianza
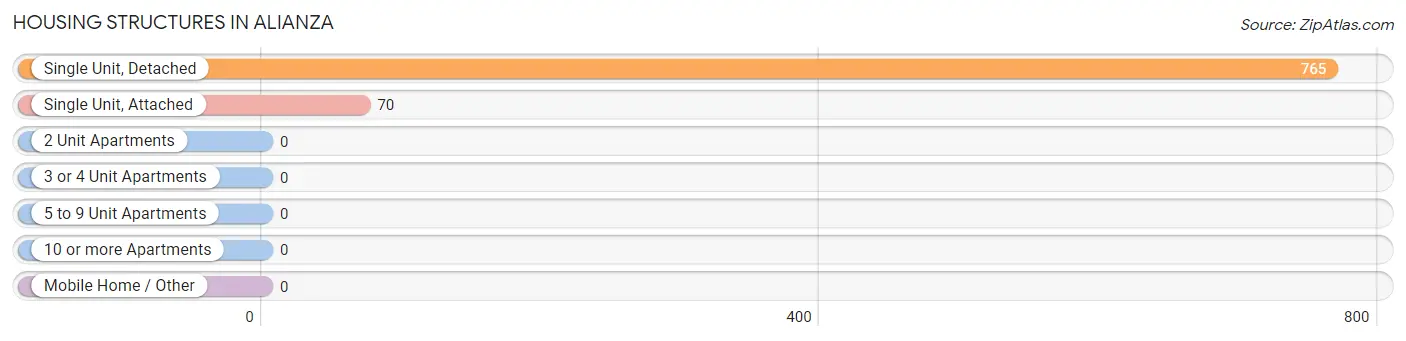
| Structure Type | # Housing Units | % Housing Units |
| Single Unit, Detached | 765 | 91.6% |
| Single Unit, Attached | 70 | 8.4% |
| 2 Unit Apartments | 0 | 0.0% |
| 3 or 4 Unit Apartments | 0 | 0.0% |
| 5 to 9 Unit Apartments | 0 | 0.0% |
| 10 or more Apartments | 0 | 0.0% |
| Mobile Home / Other | 0 | 0.0% |
| Total | 835 | 100.0% |
Housing Structures by Occupancy in Alianza
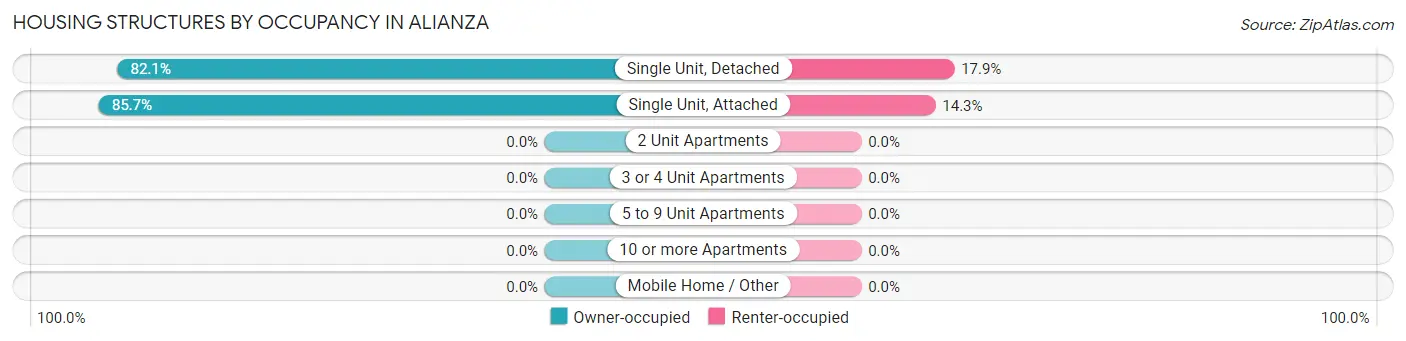
| Structure Type | Owner-occupied | Renter-occupied |
| Single Unit, Detached | 628 (82.1%) | 137 (17.9%) |
| Single Unit, Attached | 60 (85.7%) | 10 (14.3%) |
| 2 Unit Apartments | 0 (0.0%) | 0 (0.0%) |
| 3 or 4 Unit Apartments | 0 (0.0%) | 0 (0.0%) |
| 5 to 9 Unit Apartments | 0 (0.0%) | 0 (0.0%) |
| 10 or more Apartments | 0 (0.0%) | 0 (0.0%) |
| Mobile Home / Other | 0 (0.0%) | 0 (0.0%) |
| Total | 688 (82.4%) | 147 (17.6%) |
Housing Structures by Number of Rooms in Alianza
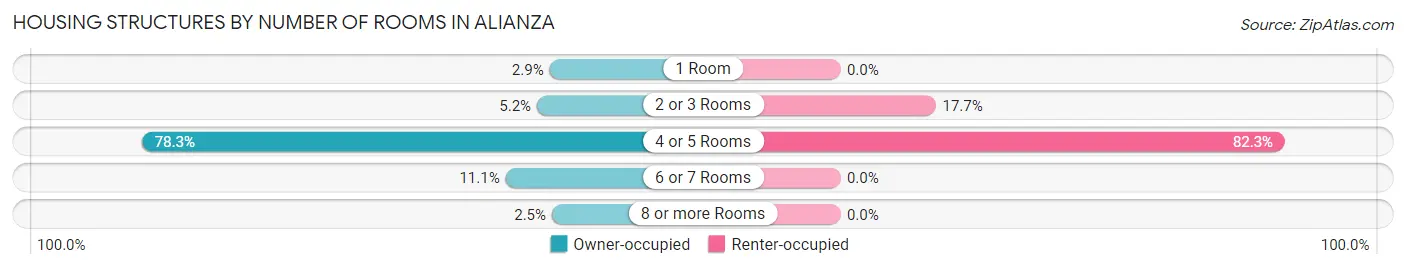
| Number of Rooms | Owner-occupied | Renter-occupied |
| 1 Room | 20 (2.9%) | 0 (0.0%) |
| 2 or 3 Rooms | 36 (5.2%) | 26 (17.7%) |
| 4 or 5 Rooms | 539 (78.3%) | 121 (82.3%) |
| 6 or 7 Rooms | 76 (11.1%) | 0 (0.0%) |
| 8 or more Rooms | 17 (2.5%) | 0 (0.0%) |
| Total | 688 (100.0%) | 147 (100.0%) |
Housing Structure by Heating Type in Alianza
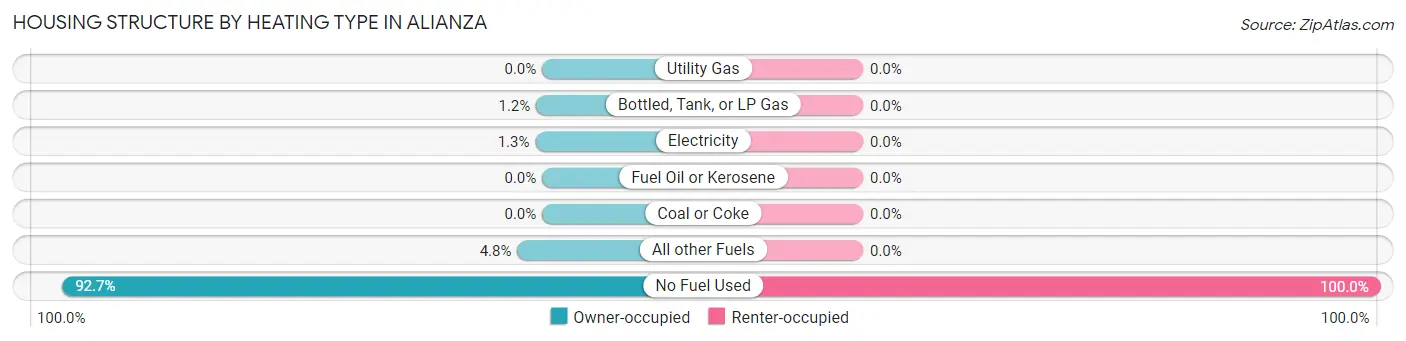
| Heating Type | Owner-occupied | Renter-occupied |
| Utility Gas | 0 (0.0%) | 0 (0.0%) |
| Bottled, Tank, or LP Gas | 8 (1.2%) | 0 (0.0%) |
| Electricity | 9 (1.3%) | 0 (0.0%) |
| Fuel Oil or Kerosene | 0 (0.0%) | 0 (0.0%) |
| Coal or Coke | 0 (0.0%) | 0 (0.0%) |
| All other Fuels | 33 (4.8%) | 0 (0.0%) |
| No Fuel Used | 638 (92.7%) | 147 (100.0%) |
| Total | 688 (100.0%) | 147 (100.0%) |
Household Vehicle Usage in Alianza
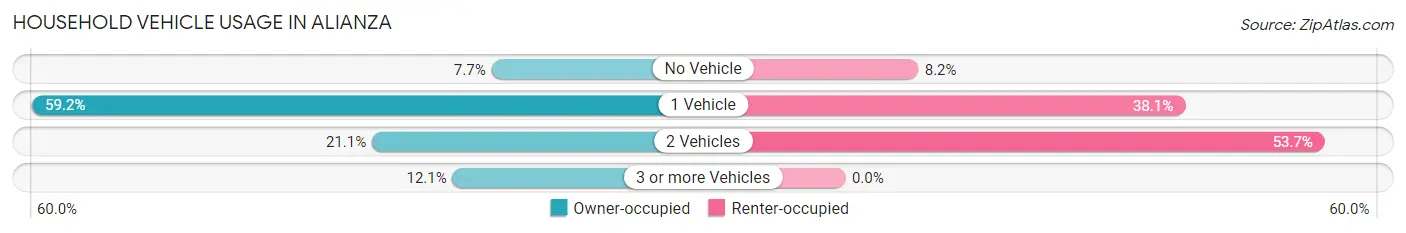
| Vehicles per Household | Owner-occupied | Renter-occupied |
| No Vehicle | 53 (7.7%) | 12 (8.2%) |
| 1 Vehicle | 407 (59.2%) | 56 (38.1%) |
| 2 Vehicles | 145 (21.1%) | 79 (53.7%) |
| 3 or more Vehicles | 83 (12.1%) | 0 (0.0%) |
| Total | 688 (100.0%) | 147 (100.0%) |
Real Estate & Mortgages in Alianza
Real Estate and Mortgage Overview in Alianza
| Characteristic | Without Mortgage | With Mortgage |
| Housing Units | 521 | 167 |
| Median Property Value | $90,800 | $117,300 |
| Median Household Income | $17,781 | $0 |
| Monthly Housing Costs | $135 | $0 |
| Real Estate Taxes | - | - |
Property Value by Mortgage Status in Alianza
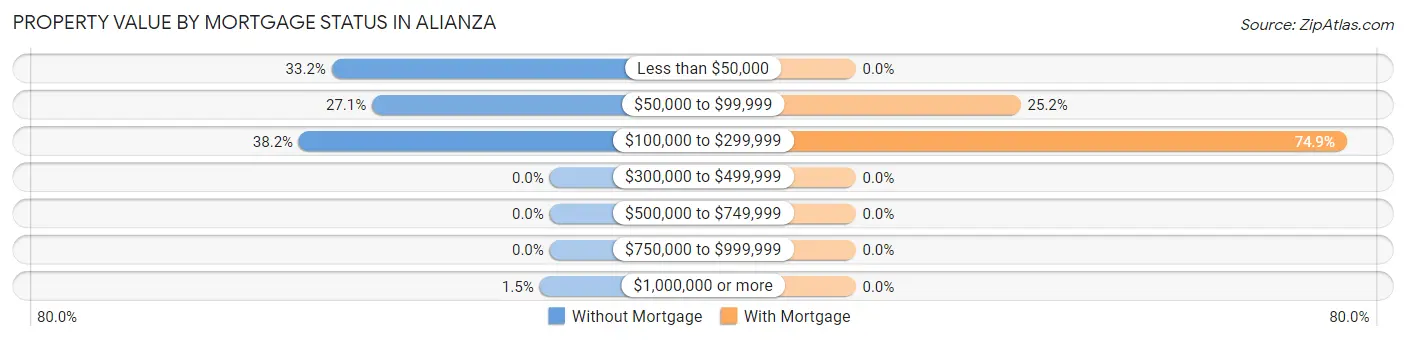
| Property Value | Without Mortgage | With Mortgage |
| Less than $50,000 | 173 (33.2%) | 0 (0.0%) |
| $50,000 to $99,999 | 141 (27.1%) | 42 (25.2%) |
| $100,000 to $299,999 | 199 (38.2%) | 125 (74.9%) |
| $300,000 to $499,999 | 0 (0.0%) | 0 (0.0%) |
| $500,000 to $749,999 | 0 (0.0%) | 0 (0.0%) |
| $750,000 to $999,999 | 0 (0.0%) | 0 (0.0%) |
| $1,000,000 or more | 8 (1.5%) | 0 (0.0%) |
| Total | 521 (100.0%) | 167 (100.0%) |
Household Income by Mortgage Status in Alianza
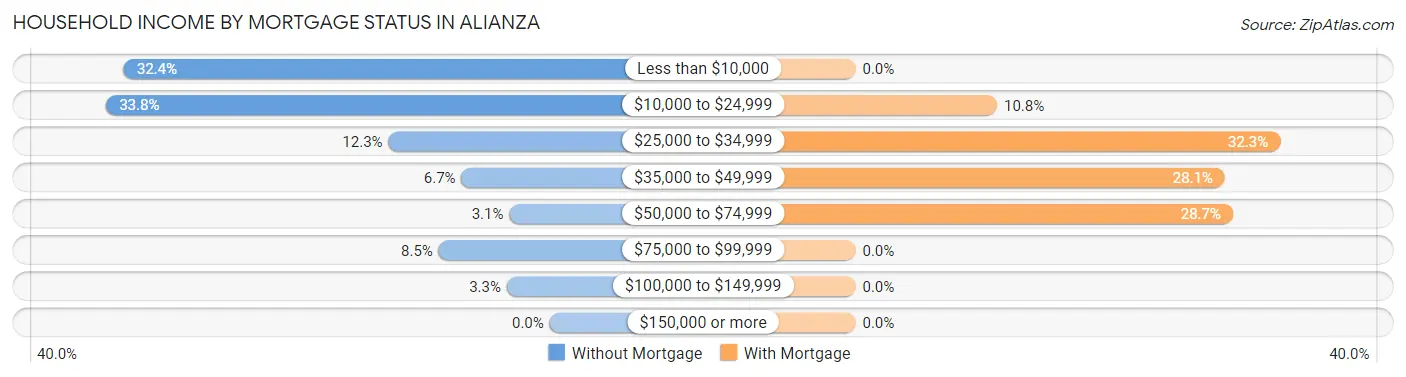
| Household Income | Without Mortgage | With Mortgage |
| Less than $10,000 | 169 (32.4%) | 0 (0.0%) |
| $10,000 to $24,999 | 176 (33.8%) | 18 (10.8%) |
| $25,000 to $34,999 | 64 (12.3%) | 54 (32.3%) |
| $35,000 to $49,999 | 35 (6.7%) | 47 (28.1%) |
| $50,000 to $74,999 | 16 (3.1%) | 48 (28.7%) |
| $75,000 to $99,999 | 44 (8.5%) | 0 (0.0%) |
| $100,000 to $149,999 | 17 (3.3%) | 0 (0.0%) |
| $150,000 or more | 0 (0.0%) | 0 (0.0%) |
| Total | 521 (100.0%) | 167 (100.0%) |
Property Value to Household Income Ratio in Alianza
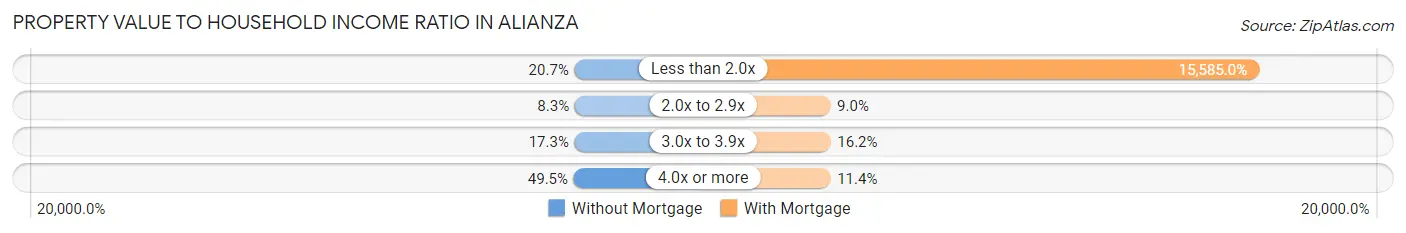
| Value-to-Income Ratio | Without Mortgage | With Mortgage |
| Less than 2.0x | 108 (20.7%) | 26,027 (15,585.0%) |
| 2.0x to 2.9x | 43 (8.3%) | 15 (9.0%) |
| 3.0x to 3.9x | 90 (17.3%) | 27 (16.2%) |
| 4.0x or more | 258 (49.5%) | 19 (11.4%) |
| Total | 521 (100.0%) | 167 (100.0%) |
Real Estate Taxes by Mortgage Status in Alianza
| Property Taxes | Without Mortgage | With Mortgage |
| Less than $800 | 0 (0.0%) | 0 (0.0%) |
| $800 to $1,499 | 0 (0.0%) | 0 (0.0%) |
| $800 to $1,499 | 0 (0.0%) | 0 (0.0%) |
| Total | 521 (100.0%) | 167 (100.0%) |
Health & Disability in Alianza
Health Insurance Coverage by Age in Alianza
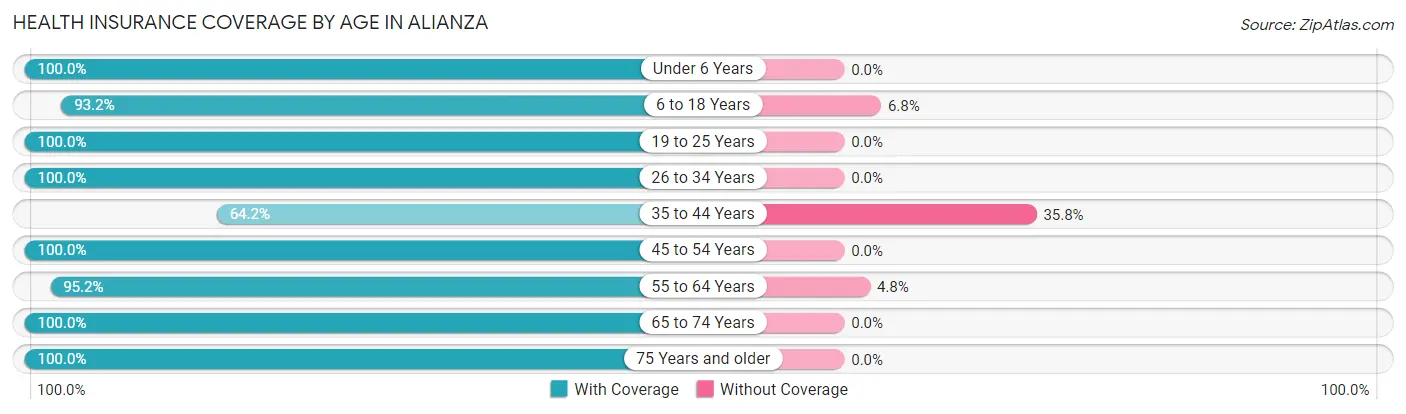
| Age Bracket | With Coverage | Without Coverage |
| Under 6 Years | 84 (100.0%) | 0 (0.0%) |
| 6 to 18 Years | 177 (93.2%) | 13 (6.8%) |
| 19 to 25 Years | 147 (100.0%) | 0 (0.0%) |
| 26 to 34 Years | 157 (100.0%) | 0 (0.0%) |
| 35 to 44 Years | 154 (64.2%) | 86 (35.8%) |
| 45 to 54 Years | 313 (100.0%) | 0 (0.0%) |
| 55 to 64 Years | 299 (95.2%) | 15 (4.8%) |
| 65 to 74 Years | 438 (100.0%) | 0 (0.0%) |
| 75 Years and older | 124 (100.0%) | 0 (0.0%) |
| Total | 1,893 (94.3%) | 114 (5.7%) |
Health Insurance Coverage by Citizenship Status in Alianza
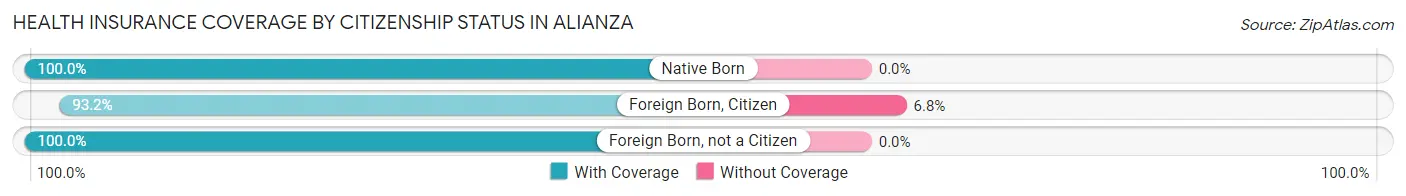
| Citizenship Status | With Coverage | Without Coverage |
| Native Born | 84 (100.0%) | 0 (0.0%) |
| Foreign Born, Citizen | 177 (93.2%) | 13 (6.8%) |
| Foreign Born, not a Citizen | 147 (100.0%) | 0 (0.0%) |
Health Insurance Coverage by Household Income in Alianza
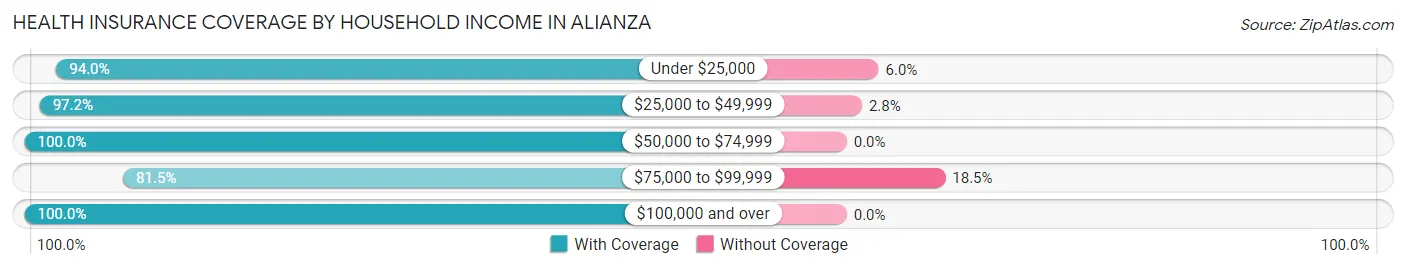
| Household Income | With Coverage | Without Coverage |
| Under $25,000 | 1,104 (94.0%) | 70 (6.0%) |
| $25,000 to $49,999 | 514 (97.2%) | 15 (2.8%) |
| $50,000 to $74,999 | 69 (100.0%) | 0 (0.0%) |
| $75,000 to $99,999 | 128 (81.5%) | 29 (18.5%) |
| $100,000 and over | 62 (100.0%) | 0 (0.0%) |
Public vs Private Health Insurance Coverage by Age in Alianza
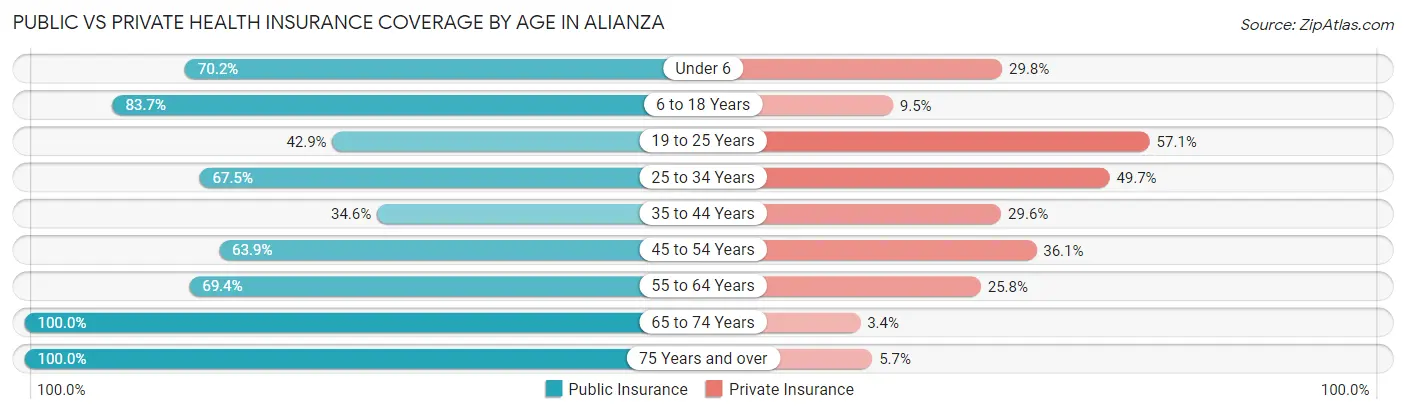
| Age Bracket | Public Insurance | Private Insurance |
| Under 6 | 59 (70.2%) | 25 (29.8%) |
| 6 to 18 Years | 159 (83.7%) | 18 (9.5%) |
| 19 to 25 Years | 63 (42.9%) | 84 (57.1%) |
| 25 to 34 Years | 106 (67.5%) | 78 (49.7%) |
| 35 to 44 Years | 83 (34.6%) | 71 (29.6%) |
| 45 to 54 Years | 200 (63.9%) | 113 (36.1%) |
| 55 to 64 Years | 218 (69.4%) | 81 (25.8%) |
| 65 to 74 Years | 438 (100.0%) | 15 (3.4%) |
| 75 Years and over | 124 (100.0%) | 7 (5.7%) |
| Total | 1,450 (72.3%) | 492 (24.5%) |
Disability Status by Sex by Age in Alianza
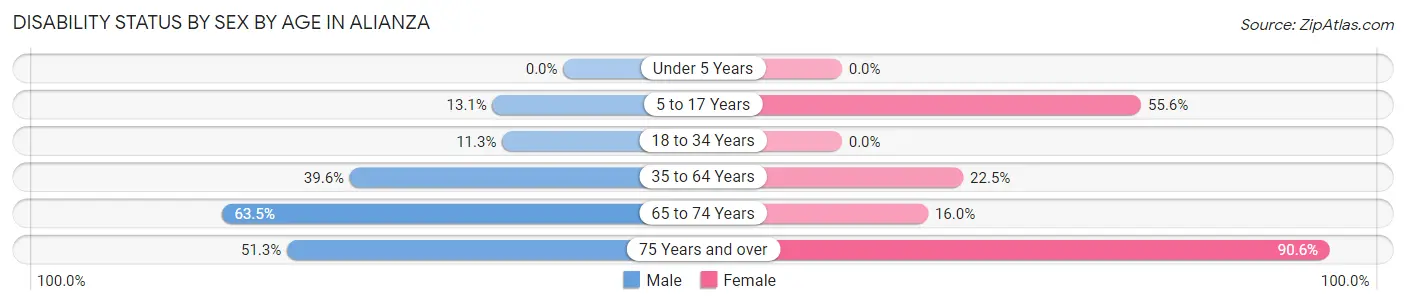
| Age Bracket | Male | Female |
| Under 5 Years | 0 (0.0%) | 0 (0.0%) |
| 5 to 17 Years | 13 (13.1%) | 35 (55.6%) |
| 18 to 34 Years | 28 (11.3%) | 0 (0.0%) |
| 35 to 64 Years | 187 (39.6%) | 89 (22.5%) |
| 65 to 74 Years | 151 (63.4%) | 32 (16.0%) |
| 75 Years and over | 20 (51.3%) | 77 (90.6%) |
Disability Class by Sex by Age in Alianza
Disability Class: Hearing Difficulty
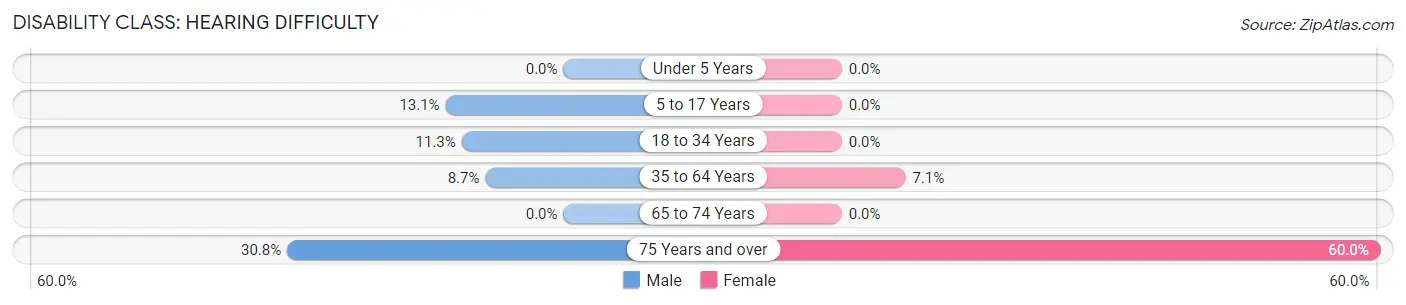
| Age Bracket | Male | Female |
| Under 5 Years | 0 (0.0%) | 0 (0.0%) |
| 5 to 17 Years | 13 (13.1%) | 0 (0.0%) |
| 18 to 34 Years | 28 (11.3%) | 0 (0.0%) |
| 35 to 64 Years | 41 (8.7%) | 28 (7.1%) |
| 65 to 74 Years | 0 (0.0%) | 0 (0.0%) |
| 75 Years and over | 12 (30.8%) | 51 (60.0%) |
Disability Class: Vision Difficulty
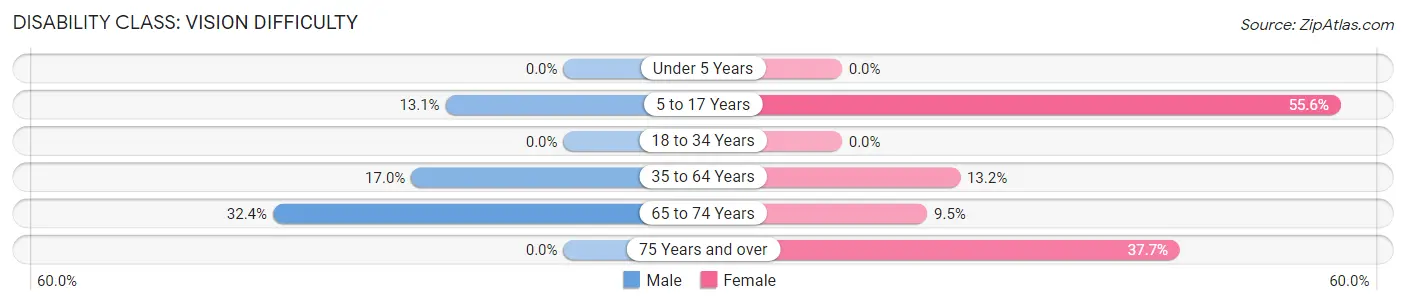
| Age Bracket | Male | Female |
| Under 5 Years | 0 (0.0%) | 0 (0.0%) |
| 5 to 17 Years | 13 (13.1%) | 35 (55.6%) |
| 18 to 34 Years | 0 (0.0%) | 0 (0.0%) |
| 35 to 64 Years | 80 (17.0%) | 52 (13.2%) |
| 65 to 74 Years | 77 (32.4%) | 19 (9.5%) |
| 75 Years and over | 0 (0.0%) | 32 (37.7%) |
Disability Class: Cognitive Difficulty
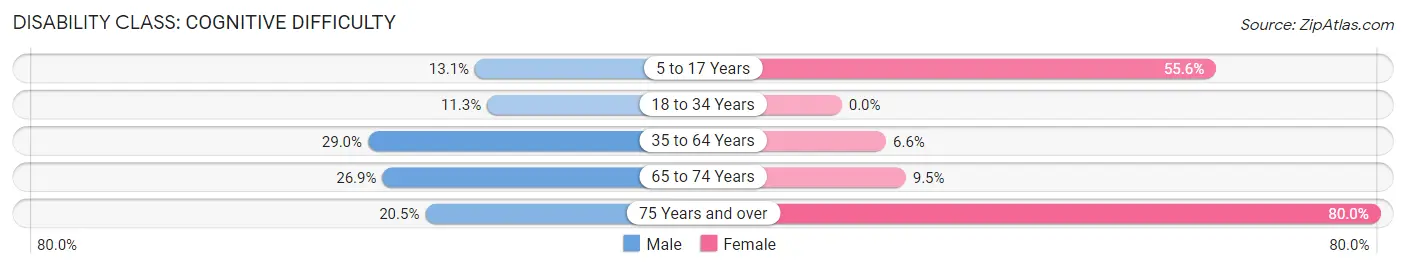
| Age Bracket | Male | Female |
| 5 to 17 Years | 13 (13.1%) | 35 (55.6%) |
| 18 to 34 Years | 28 (11.3%) | 0 (0.0%) |
| 35 to 64 Years | 137 (29.0%) | 26 (6.6%) |
| 65 to 74 Years | 64 (26.9%) | 19 (9.5%) |
| 75 Years and over | 8 (20.5%) | 68 (80.0%) |
Disability Class: Ambulatory Difficulty
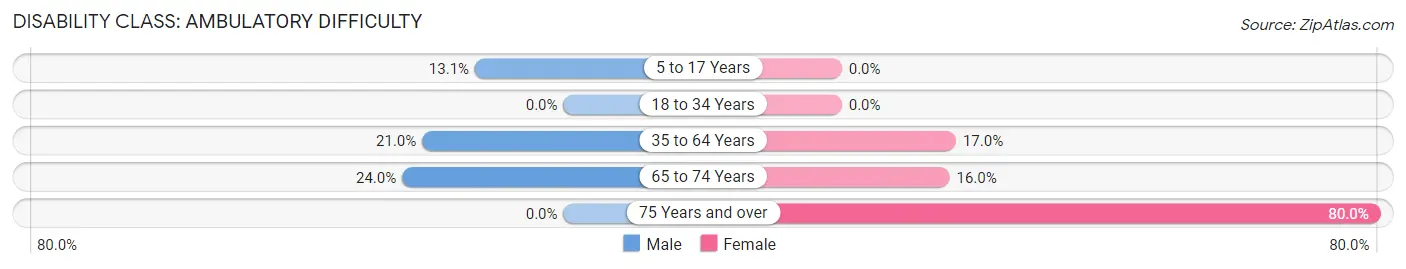
| Age Bracket | Male | Female |
| 5 to 17 Years | 13 (13.1%) | 0 (0.0%) |
| 18 to 34 Years | 0 (0.0%) | 0 (0.0%) |
| 35 to 64 Years | 99 (21.0%) | 67 (17.0%) |
| 65 to 74 Years | 57 (23.9%) | 32 (16.0%) |
| 75 Years and over | 0 (0.0%) | 68 (80.0%) |
Disability Class: Self-Care Difficulty
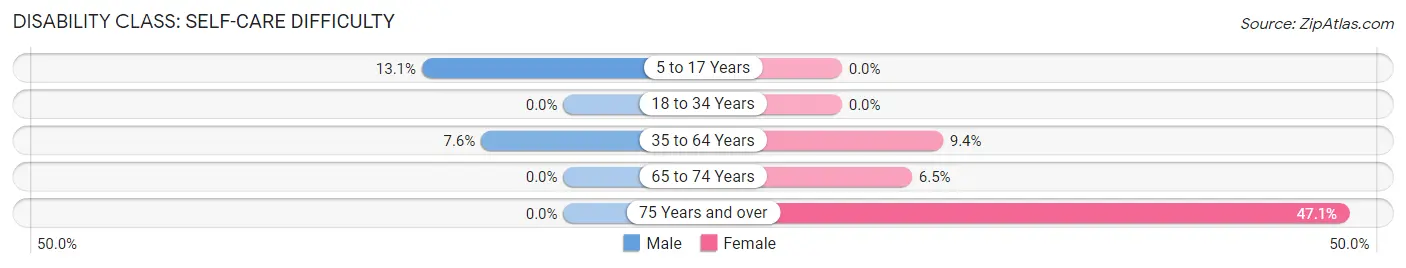
| Age Bracket | Male | Female |
| 5 to 17 Years | 13 (13.1%) | 0 (0.0%) |
| 18 to 34 Years | 0 (0.0%) | 0 (0.0%) |
| 35 to 64 Years | 36 (7.6%) | 37 (9.4%) |
| 65 to 74 Years | 0 (0.0%) | 13 (6.5%) |
| 75 Years and over | 0 (0.0%) | 40 (47.1%) |
Technology Access in Alianza
Computing Device Access in Alianza
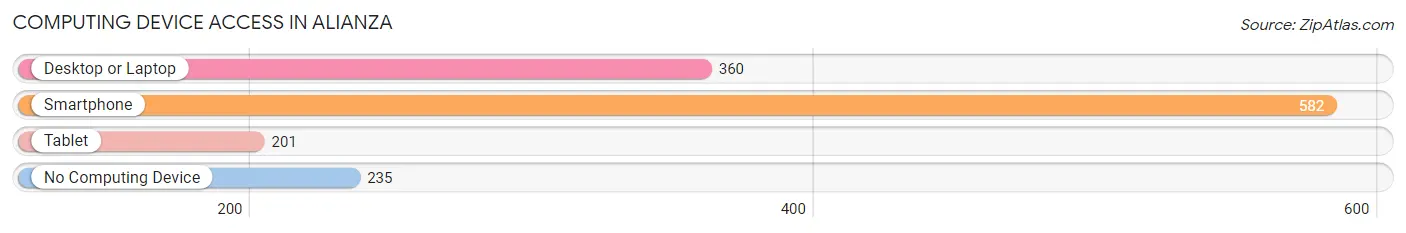
| Device Type | # Households | % Households |
| Desktop or Laptop | 360 | 43.1% |
| Smartphone | 582 | 69.7% |
| Tablet | 201 | 24.1% |
| No Computing Device | 235 | 28.1% |
| Total | 835 | 100.0% |
Internet Access in Alianza
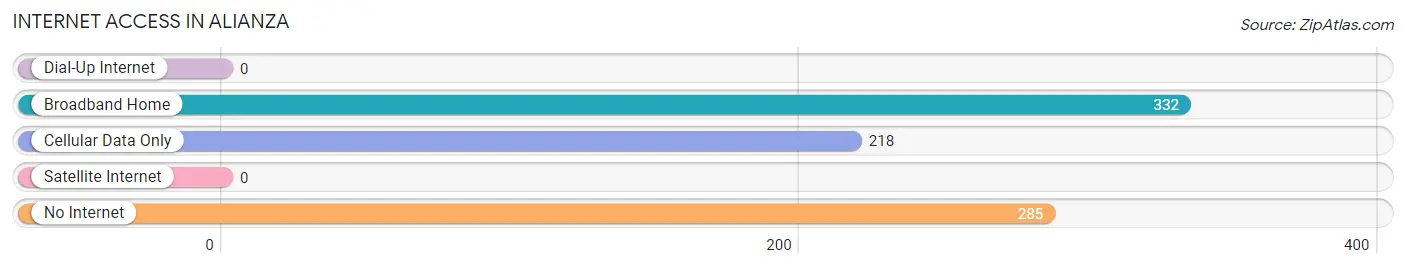
| Internet Type | # Households | % Households |
| Dial-Up Internet | 0 | 0.0% |
| Broadband Home | 332 | 39.8% |
| Cellular Data Only | 218 | 26.1% |
| Satellite Internet | 0 | 0.0% |
| No Internet | 285 | 34.1% |
| Total | 835 | 100.0% |
Alianza Summary
Alianza is a municipality located in the northern region of Puerto Rico, in the northern coast of the island. It is part of the San Juan-Caguas-Guaynabo Metropolitan Statistical Area. As of the 2010 census, Alianza had a population of 8,845.
Geography
Alianza is located in the northern region of Puerto Rico, in the northern coast of the island. It is bordered by the municipalities of San Juan, Toa Baja, Dorado, Vega Alta, and Vega Baja. The municipality is located in the northern part of the island, and is part of the San Juan-Caguas-Guaynabo Metropolitan Statistical Area.
The municipality has a total area of 8.3 square miles, of which 7.9 square miles is land and 0.4 square miles is water. The terrain is mostly flat, with some hills in the northern part of the municipality. The highest point is Cerro de la Cruz, which is located in the northern part of the municipality and has an elevation of 1,000 feet.
Climate
Alianza has a tropical climate, with temperatures ranging from an average low of 70°F in the winter to an average high of 90°F in the summer. The average annual precipitation is about 50 inches.
Demographics
As of the 2010 census, Alianza had a population of 8,845. The population was spread out, with 44.3% under the age of 18, 15.2% from 18 to 24, 28.2% from 25 to 44, 10.2% from 45 to 64, and 2.1% who were 65 years of age or older. The median age was 24.7 years.
The racial makeup of the municipality was 79.2% White, 0.3% African American, 0.2% Native American, 0.2% Asian, 0.1% Pacific Islander, 17.7% from other races, and 2.3% from two or more races. Hispanic or Latino of any race were 99.2% of the population.
Economy
Alianza is primarily a residential community, with most of its residents employed in the nearby cities of San Juan and Caguas. The municipality has a few small businesses, including restaurants, convenience stores, and small retail stores.
The municipality is home to several industrial parks, including the Alianza Industrial Park, which is home to several manufacturing and distribution companies. The municipality also has a few small farms, which produce fruits and vegetables for local consumption.
Education
Alianza is served by the Puerto Rico Department of Education. The municipality has two public elementary schools, one public middle school, and one public high school. There are also several private schools in the municipality.
Transportation
Alianza is served by the Puerto Rico Highway System, with several major highways passing through the municipality. The municipality is also served by the San Juan Metropolitan Bus Authority, which provides public transportation to the nearby cities of San Juan and Caguas.
Conclusion
Alianza is a municipality located in the northern region of Puerto Rico, in the northern coast of the island. It is part of the San Juan-Caguas-Guaynabo Metropolitan Statistical Area. As of the 2010 census, Alianza had a population of 8,845. The municipality is primarily a residential community, with most of its residents employed in the nearby cities of San Juan and Caguas. The municipality is served by the Puerto Rico Highway System, with several major highways passing through the municipality, and by the San Juan Metropolitan Bus Authority, which provides public transportation to the nearby cities of San Juan and Caguas. Alianza is also home to several industrial parks, including the Alianza Industrial Park, which is home to several manufacturing and distribution companies. The municipality is served by the Puerto Rico Department of Education, with two public elementary schools, one public middle school, and one public high school, as well as several private schools.
Common Questions
What is Per Capita Income in Alianza?
Per Capita income in Alianza is $11,268.
What is the Median Family Income in Alianza?
Median Family Income in Alianza is $21,623.
What is the Median Household income in Alianza?
Median Household Income in Alianza is $18,909.
What is Income or Wage Gap in Alianza?
Income or Wage Gap in Alianza is 43.4%.
Women in Alianza earn 56.6 cents for every dollar earned by a man.
What is Inequality or Gini Index in Alianza?
Inequality or Gini Index in Alianza is 0.49.
What is the Total Population of Alianza?
Total Population of Alianza is 2,010.
What is the Total Male Population of Alianza?
Total Male Population of Alianza is 1,136.
What is the Total Female Population of Alianza?
Total Female Population of Alianza is 874.
What is the Ratio of Males per 100 Females in Alianza?
There are 129.98 Males per 100 Females in Alianza.
What is the Ratio of Females per 100 Males in Alianza?
There are 76.94 Females per 100 Males in Alianza.
What is the Median Population Age in Alianza?
Median Population Age in Alianza is 50.9 Years.
What is the Average Family Size in Alianza
Average Family Size in Alianza is 2.9 People.
What is the Average Household Size in Alianza
Average Household Size in Alianza is 2.4 People.
How Large is the Labor Force in Alianza?
There are 577 People in the Labor Forcein in Alianza.
What is the Percentage of People in the Labor Force in Alianza?
32.4% of People are in the Labor Force in Alianza.
What is the Unemployment Rate in Alianza?
Unemployment Rate in Alianza is 3.8%.