Zip Codes with the Highest Percentage of Population Employed in Legal Services & Support in Farmington, MI
RELATED REPORTS & OPTIONS
Legal Services & Support
Farmington
Compare Zip Codes
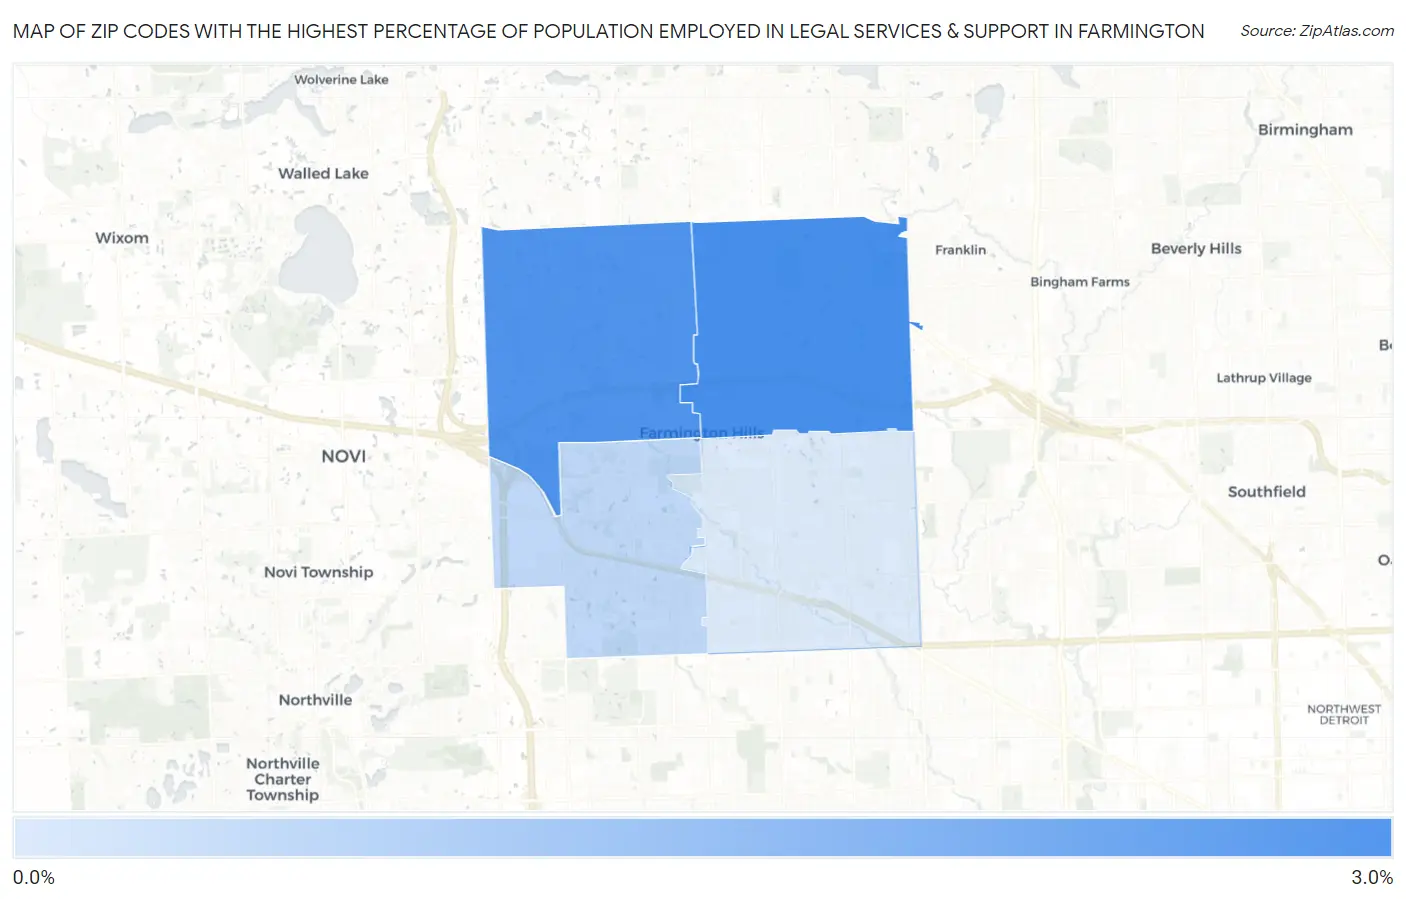
Map of Zip Codes with the Highest Percentage of Population Employed in Legal Services & Support in Farmington
0.65%
2.7%
Zip Codes with the Highest Percentage of Population Employed in Legal Services & Support in Farmington, MI
| Zip Code | % Employed | vs State | vs National | |
| 1. | 48334 | 2.7% | 0.89%(+1.81)#30 | 1.2%(+1.51)#2,207 |
| 2. | 48331 | 2.6% | 0.89%(+1.67)#35 | 1.2%(+1.37)#2,426 |
| 3. | 48335 | 1.0% | 0.89%(+0.161)#183 | 1.2%(-0.138)#7,510 |
| 4. | 48336 | 0.65% | 0.89%(-0.235)#316 | 1.2%(-0.533)#10,940 |
1
Common Questions
What are the Top 3 Zip Codes with the Highest Percentage of Population Employed in Legal Services & Support in Farmington, MI?
Top 3 Zip Codes with the Highest Percentage of Population Employed in Legal Services & Support in Farmington, MI are:
What zip code has the Highest Percentage of Population Employed in Legal Services & Support in Farmington, MI?
48334 has the Highest Percentage of Population Employed in Legal Services & Support in Farmington, MI with 2.7%.
What is the Percentage of Population Employed in Legal Services & Support in Farmington, MI?
Percentage of Population Employed in Legal Services & Support in Farmington is 0.71%.
What is the Percentage of Population Employed in Legal Services & Support in Michigan?
Percentage of Population Employed in Legal Services & Support in Michigan is 0.89%.
What is the Percentage of Population Employed in Legal Services & Support in the United States?
Percentage of Population Employed in Legal Services & Support in the United States is 1.2%.