Zip Codes with the Highest Percentage of Population Employed in Transportation & Warehousing in Bowling Green, KY
RELATED REPORTS & OPTIONS
Transportation & Warehousing
Bowling Green
Compare Zip Codes
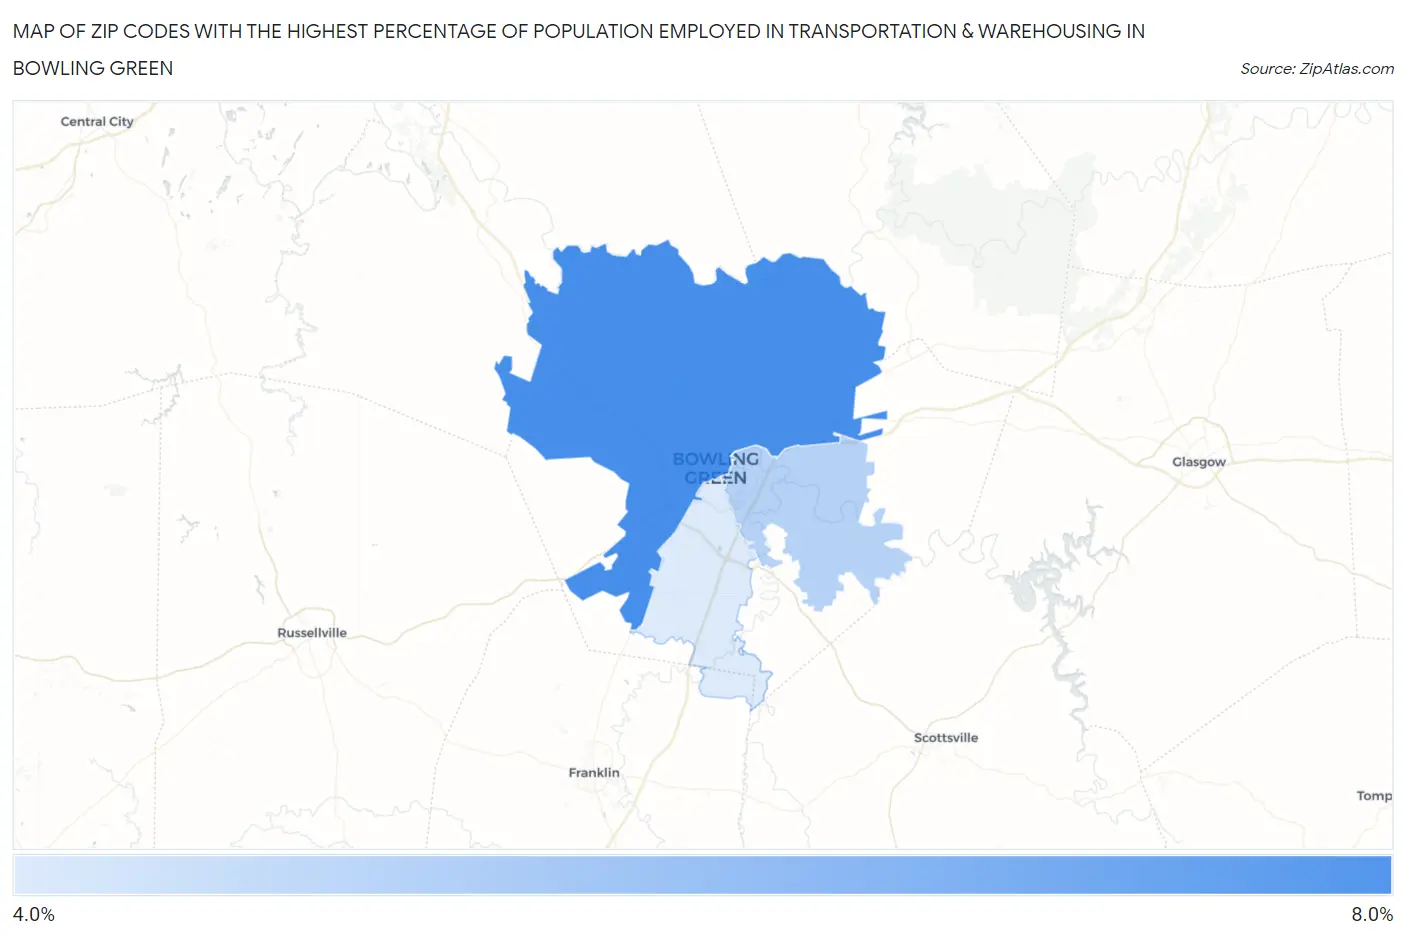
Map of Zip Codes with the Highest Percentage of Population Employed in Transportation & Warehousing in Bowling Green
4.4%
7.1%
Zip Codes with the Highest Percentage of Population Employed in Transportation & Warehousing in Bowling Green, KY
| Zip Code | % Employed | vs State | vs National | |
| 1. | 42101 | 7.1% | 5.7%(+1.34)#168 | 4.9%(+2.14)#6,381 |
| 2. | 42103 | 5.1% | 5.7%(-0.638)#274 | 4.9%(+0.160)#11,598 |
| 3. | 42104 | 4.4% | 5.7%(-1.35)#318 | 4.9%(-0.554)#14,206 |
1
Common Questions
What are the Top Zip Codes with the Highest Percentage of Population Employed in Transportation & Warehousing in Bowling Green, KY?
Top Zip Codes with the Highest Percentage of Population Employed in Transportation & Warehousing in Bowling Green, KY are:
What zip code has the Highest Percentage of Population Employed in Transportation & Warehousing in Bowling Green, KY?
42101 has the Highest Percentage of Population Employed in Transportation & Warehousing in Bowling Green, KY with 7.1%.
What is the Percentage of Population Employed in Transportation & Warehousing in Bowling Green, KY?
Percentage of Population Employed in Transportation & Warehousing in Bowling Green is 6.7%.
What is the Percentage of Population Employed in Transportation & Warehousing in Kentucky?
Percentage of Population Employed in Transportation & Warehousing in Kentucky is 5.7%.
What is the Percentage of Population Employed in Transportation & Warehousing in the United States?
Percentage of Population Employed in Transportation & Warehousing in the United States is 4.9%.