Zip Codes with the Highest Percentage of Population Employed in Architecture & Engineering in Bowling Green, KY
RELATED REPORTS & OPTIONS
Architecture & Engineering
Bowling Green
Compare Zip Codes
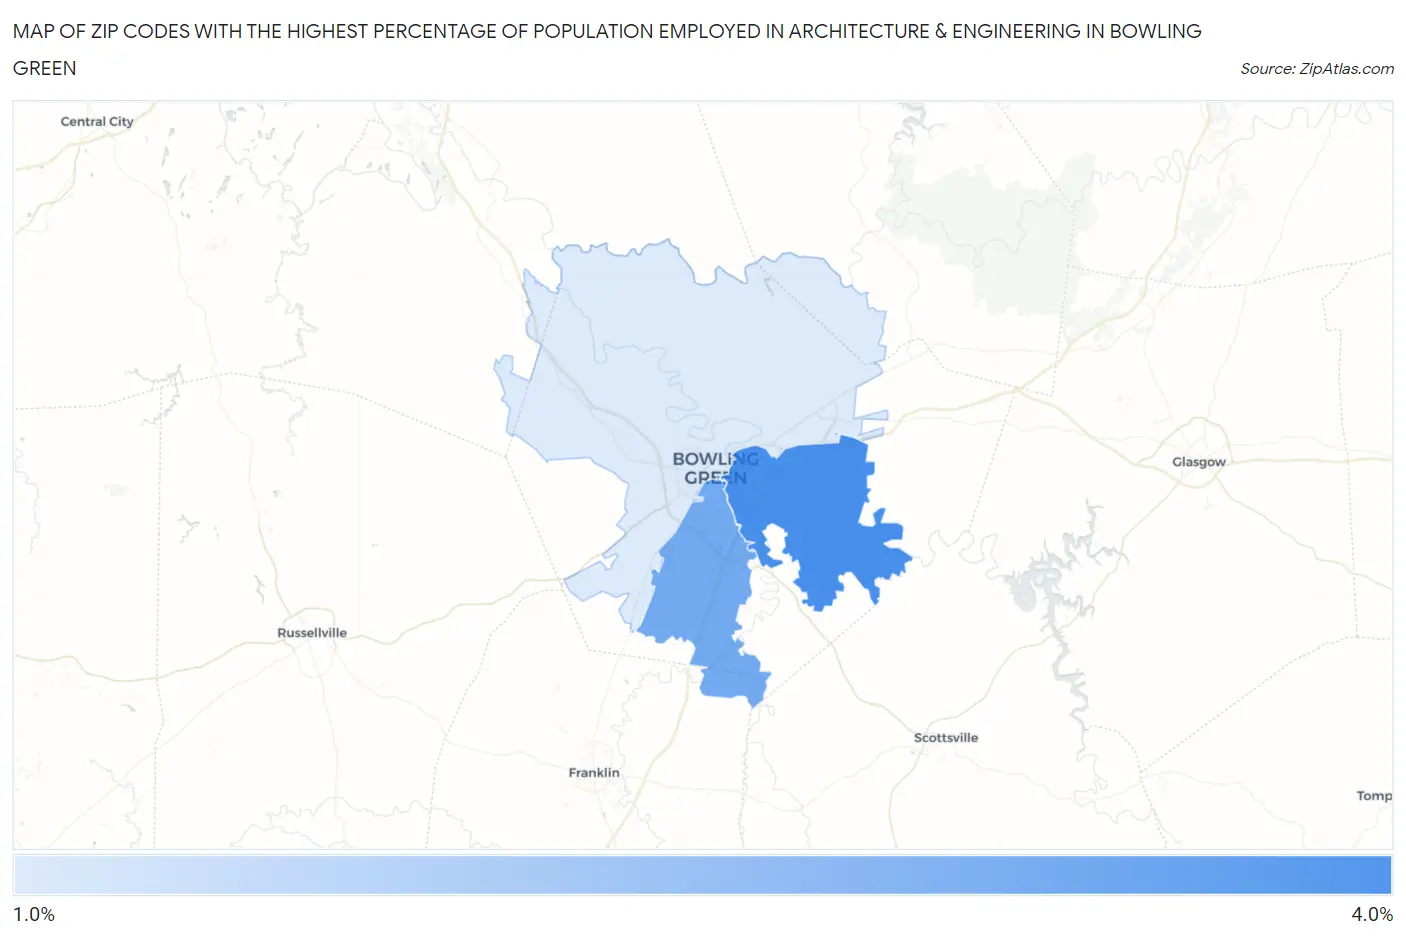
Map of Zip Codes with the Highest Percentage of Population Employed in Architecture & Engineering in Bowling Green
1.1%
3.5%
Zip Codes with the Highest Percentage of Population Employed in Architecture & Engineering in Bowling Green, KY
| Zip Code | % Employed | vs State | vs National | |
| 1. | 42103 | 3.5% | 1.7%(+1.80)#54 | 2.1%(+1.35)#3,750 |
| 2. | 42104 | 2.8% | 1.7%(+1.08)#86 | 2.1%(+0.631)#5,858 |
| 3. | 42101 | 1.1% | 1.7%(-0.634)#236 | 2.1%(-1.08)#16,128 |
1
Common Questions
What are the Top Zip Codes with the Highest Percentage of Population Employed in Architecture & Engineering in Bowling Green, KY?
Top Zip Codes with the Highest Percentage of Population Employed in Architecture & Engineering in Bowling Green, KY are:
What zip code has the Highest Percentage of Population Employed in Architecture & Engineering in Bowling Green, KY?
42103 has the Highest Percentage of Population Employed in Architecture & Engineering in Bowling Green, KY with 3.5%.
What is the Percentage of Population Employed in Architecture & Engineering in Bowling Green, KY?
Percentage of Population Employed in Architecture & Engineering in Bowling Green is 1.9%.
What is the Percentage of Population Employed in Architecture & Engineering in Kentucky?
Percentage of Population Employed in Architecture & Engineering in Kentucky is 1.7%.
What is the Percentage of Population Employed in Architecture & Engineering in the United States?
Percentage of Population Employed in Architecture & Engineering in the United States is 2.1%.