Zip Codes with the Highest Percentage of Population Employed in Cleaning & Maintenance in Bowling Green, KY
RELATED REPORTS & OPTIONS
Cleaning & Maintenance
Bowling Green
Compare Zip Codes
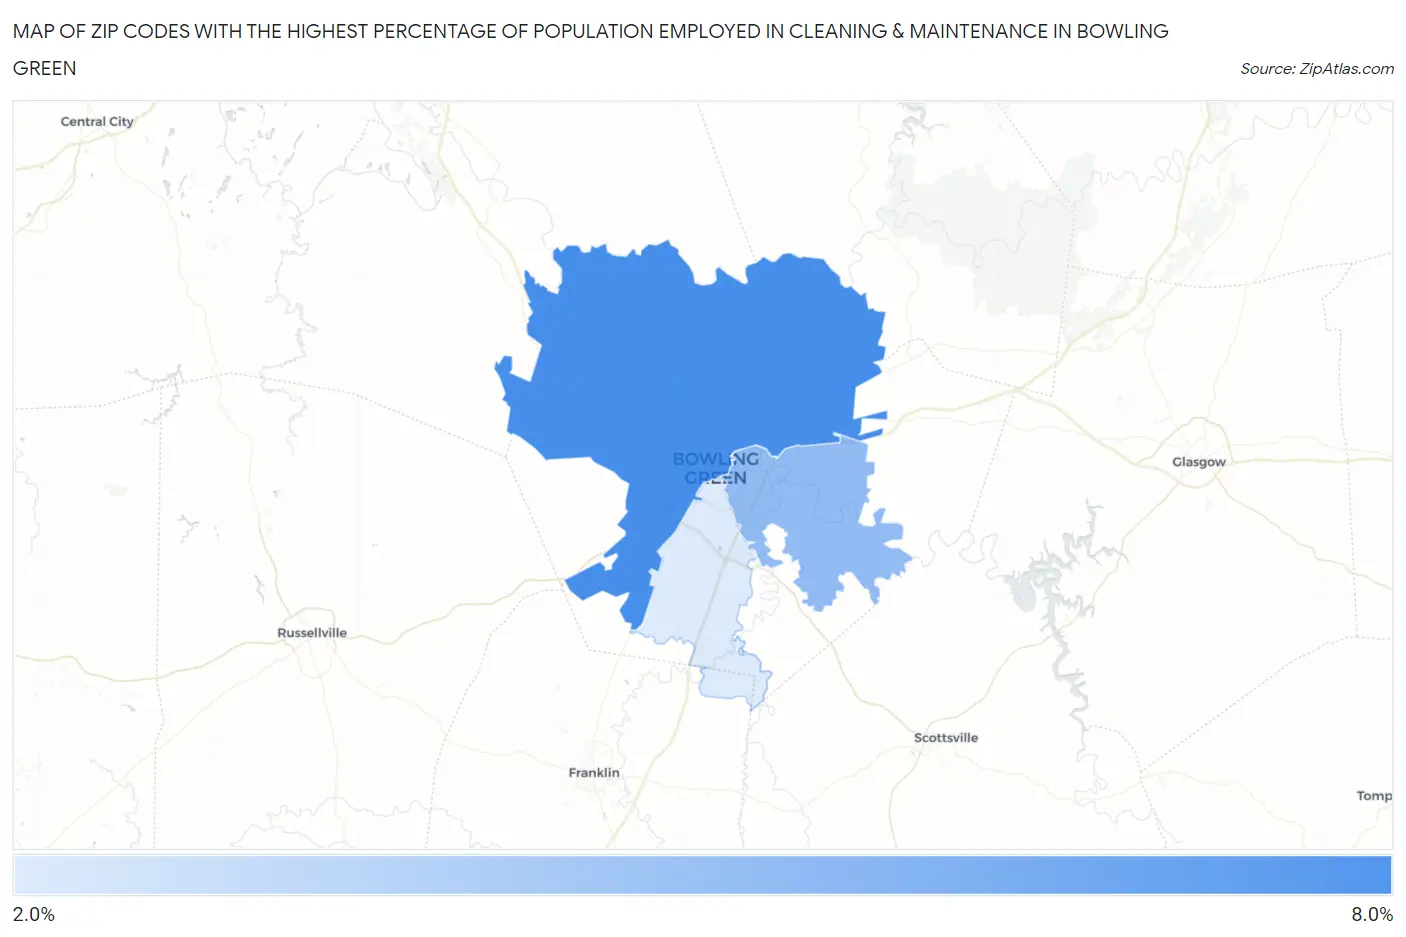
Map of Zip Codes with the Highest Percentage of Population Employed in Cleaning & Maintenance in Bowling Green
2.2%
6.1%
Zip Codes with the Highest Percentage of Population Employed in Cleaning & Maintenance in Bowling Green, KY
| Zip Code | % Employed | vs State | vs National | |
| 1. | 42101 | 6.1% | 3.3%(+2.83)#129 | 3.5%(+2.66)#5,379 |
| 2. | 42103 | 4.2% | 3.3%(+0.857)#215 | 3.5%(+0.686)#10,662 |
| 3. | 42104 | 2.2% | 3.3%(-1.12)#390 | 3.5%(-1.29)#20,082 |
1
Common Questions
What are the Top Zip Codes with the Highest Percentage of Population Employed in Cleaning & Maintenance in Bowling Green, KY?
Top Zip Codes with the Highest Percentage of Population Employed in Cleaning & Maintenance in Bowling Green, KY are:
What zip code has the Highest Percentage of Population Employed in Cleaning & Maintenance in Bowling Green, KY?
42101 has the Highest Percentage of Population Employed in Cleaning & Maintenance in Bowling Green, KY with 6.1%.
What is the Percentage of Population Employed in Cleaning & Maintenance in Bowling Green, KY?
Percentage of Population Employed in Cleaning & Maintenance in Bowling Green is 4.6%.
What is the Percentage of Population Employed in Cleaning & Maintenance in Kentucky?
Percentage of Population Employed in Cleaning & Maintenance in Kentucky is 3.3%.
What is the Percentage of Population Employed in Cleaning & Maintenance in the United States?
Percentage of Population Employed in Cleaning & Maintenance in the United States is 3.5%.