Zip Codes with the Highest Percentage of Households Without a Vehicle in Bowling Green, KY
RELATED REPORTS & OPTIONS
Households without a Cars
Bowling Green
Compare Zip Codes
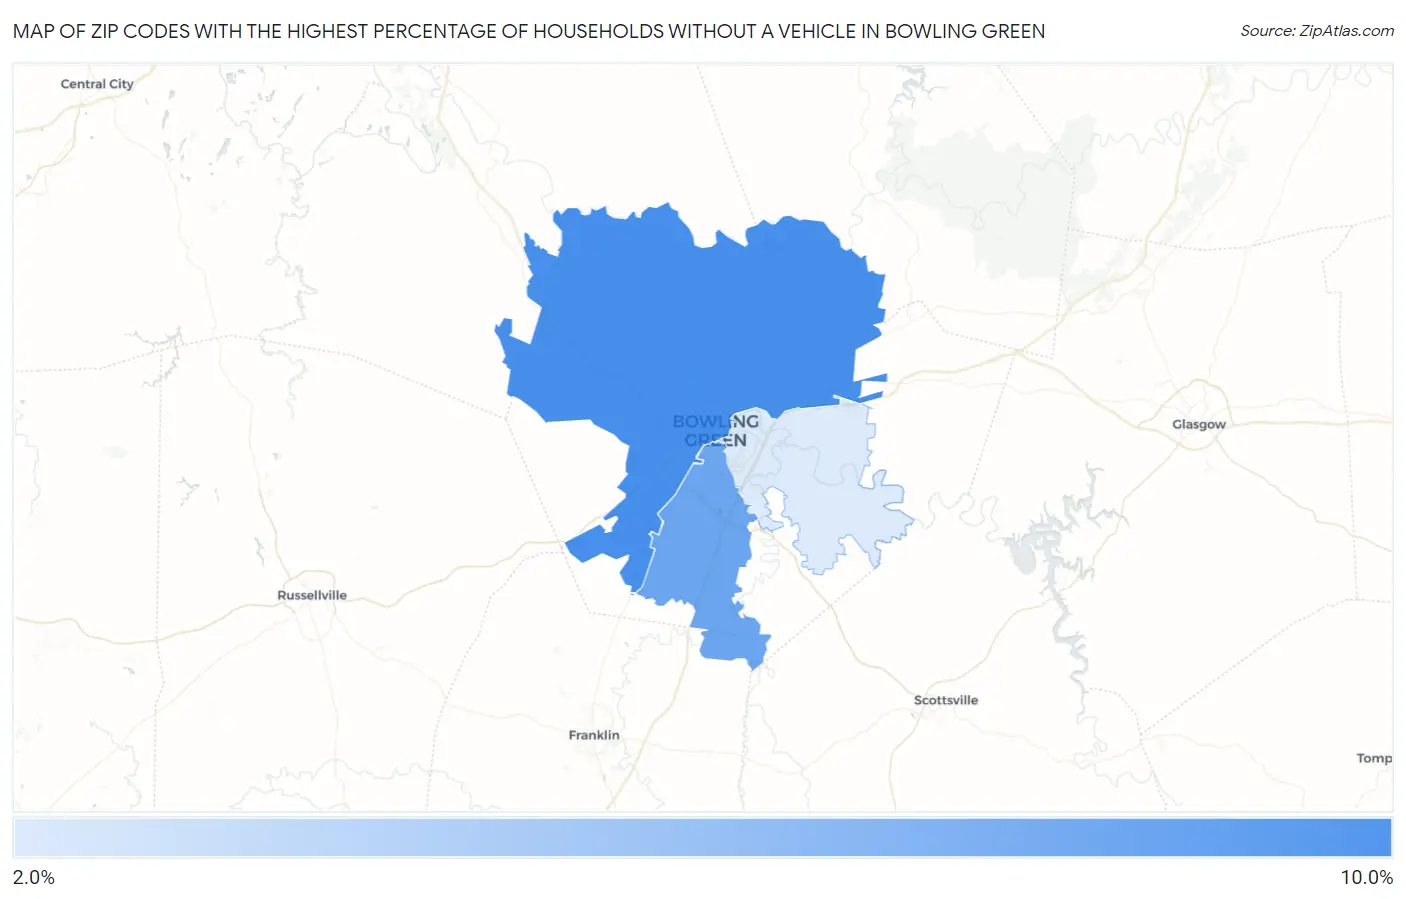
Map of Zip Codes with the Highest Percentage of Households Without a Vehicle in Bowling Green
2.2%
8.9%
Zip Codes with the Highest Percentage of Households Without a Vehicle in Bowling Green, KY
| Zip Code | Housholds Without a Car | vs State | vs National | |
| 1. | 42101 | 8.9% | 6.7%(+2.20)#184 | 8.3%(+0.600)#5,826 |
| 2. | 42104 | 7.2% | 6.7%(+0.500)#241 | 8.3%(-1.10)#8,193 |
| 3. | 42103 | 2.2% | 6.7%(-4.50)#514 | 8.3%(-6.10)#21,752 |
1
Common Questions
What are the Top Zip Codes with the Highest Percentage of Households Without a Vehicle in Bowling Green, KY?
Top Zip Codes with the Highest Percentage of Households Without a Vehicle in Bowling Green, KY are:
What zip code has the Highest Percentage of Households Without a Vehicle in Bowling Green, KY?
42101 has the Highest Percentage of Households Without a Vehicle in Bowling Green, KY with 8.9%.
What is the Percentage of Households Without a Vehicle in Bowling Green, KY?
Percentage of Households Without a Vehicle in Bowling Green is 9.2%.
What is the Percentage of Households Without a Vehicle in Kentucky?
Percentage of Households Without a Vehicle in Kentucky is 6.7%.
What is the Percentage of Households Without a Vehicle in the United States?
Percentage of Households Without a Vehicle in the United States is 8.3%.