Zip Codes with the Highest Percentage of Population Employed in Education Instruction & Library in Bowling Green, KY
RELATED REPORTS & OPTIONS
Education Instruction & Library
Bowling Green
Compare Zip Codes
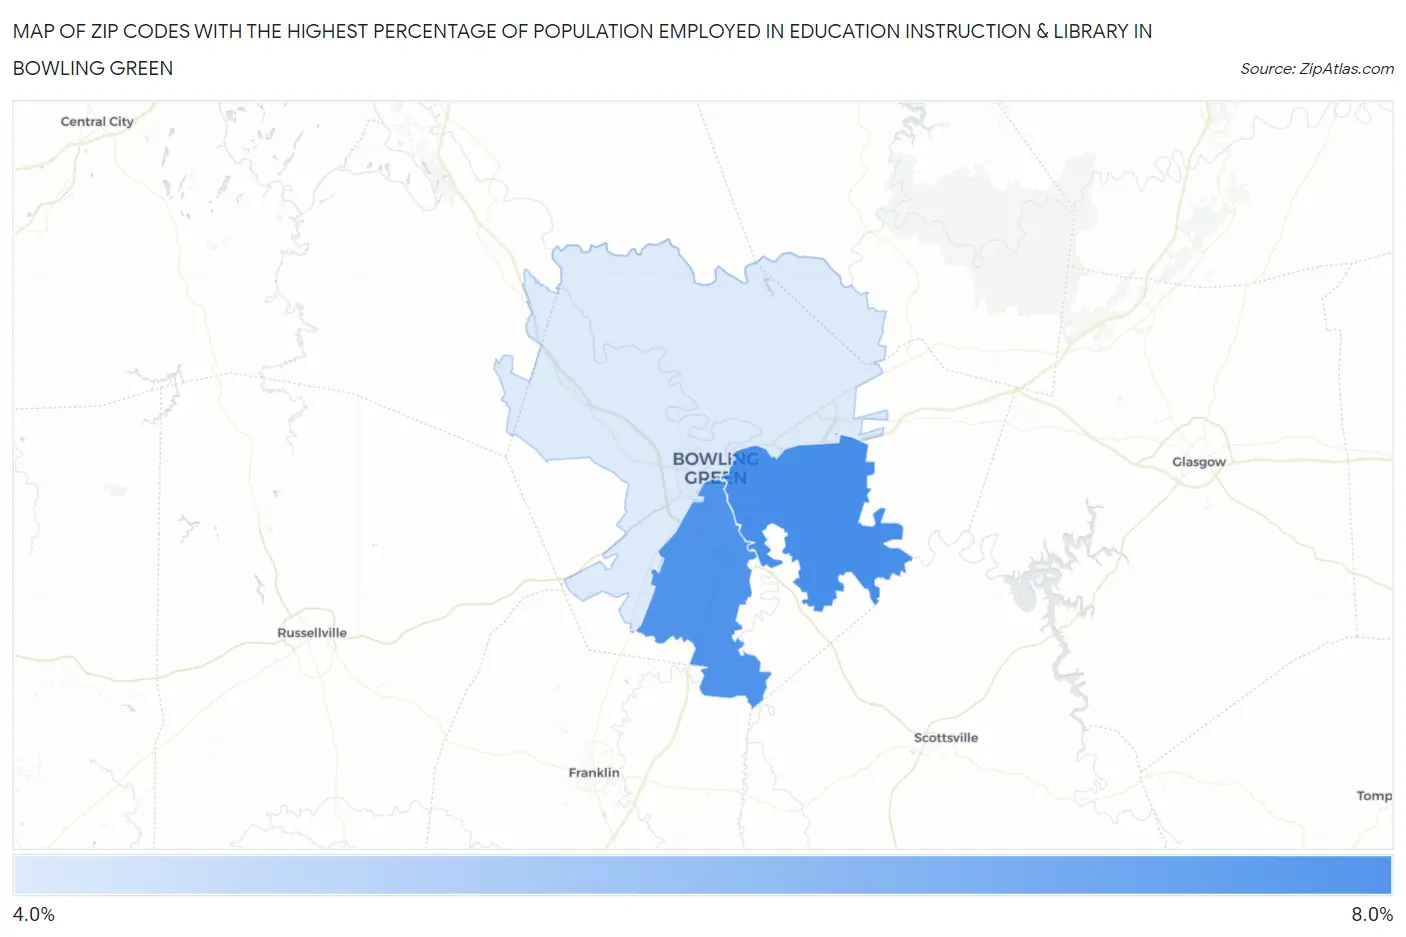
Map of Zip Codes with the Highest Percentage of Population Employed in Education Instruction & Library in Bowling Green
4.6%
6.5%
Zip Codes with the Highest Percentage of Population Employed in Education Instruction & Library in Bowling Green, KY
| Zip Code | % Employed | vs State | vs National | |
| 1. | 42103 | 6.5% | 6.0%(+0.506)#242 | 6.2%(+0.280)#11,736 |
| 2. | 42104 | 6.4% | 6.0%(+0.399)#250 | 6.2%(+0.173)#12,140 |
| 3. | 42101 | 4.6% | 6.0%(-1.32)#374 | 6.2%(-1.54)#19,165 |
1
Common Questions
What are the Top Zip Codes with the Highest Percentage of Population Employed in Education Instruction & Library in Bowling Green, KY?
Top Zip Codes with the Highest Percentage of Population Employed in Education Instruction & Library in Bowling Green, KY are:
What zip code has the Highest Percentage of Population Employed in Education Instruction & Library in Bowling Green, KY?
42103 has the Highest Percentage of Population Employed in Education Instruction & Library in Bowling Green, KY with 6.5%.
What is the Percentage of Population Employed in Education Instruction & Library in Bowling Green, KY?
Percentage of Population Employed in Education Instruction & Library in Bowling Green is 5.6%.
What is the Percentage of Population Employed in Education Instruction & Library in Kentucky?
Percentage of Population Employed in Education Instruction & Library in Kentucky is 6.0%.
What is the Percentage of Population Employed in Education Instruction & Library in the United States?
Percentage of Population Employed in Education Instruction & Library in the United States is 6.2%.