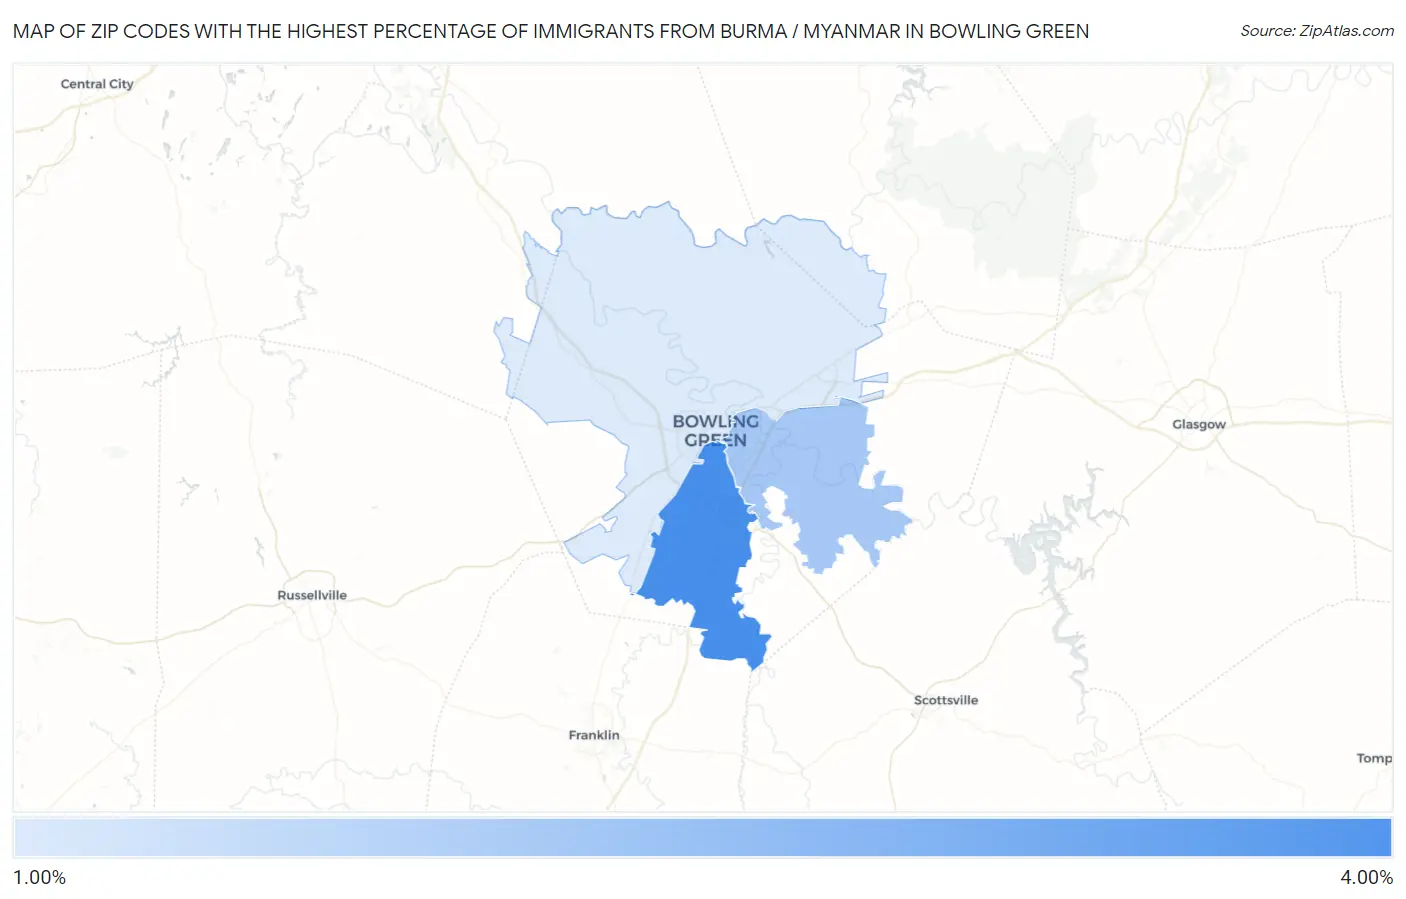
Zip Codes with the Highest Percentage of Immigrants from Burma / Myanmar in Bowling Green, KY
RELATED REPORTS & OPTIONS
Burma / Myanmar
Bowling Green
Compare Zip Codes
Map of Zip Codes with the Highest Percentage of Immigrants from Burma / Myanmar in Bowling Green
1.33%
1.78%
Zip Codes with the Highest Percentage of Immigrants from Burma / Myanmar in Bowling Green, KY
| Zip Code | Burma / Myanmar | vs State | vs National | |
| 1. | 42104 | 1.78% | 0.077%(+1.71)#4 | 0.047%(+1.73)#1,005 |
| 2. | 42103 | 1.52% | 0.077%(+1.44)#6 | 0.047%(+1.47)#1,596 |
| 3. | 42101 | 1.33% | 0.077%(+1.25)#11 | 0.047%(+1.28)#2,221 |
1
Common Questions
What are the Top Zip Codes with the Highest Percentage of Immigrants from Burma / Myanmar in Bowling Green, KY?
Top Zip Codes with the Highest Percentage of Immigrants from Burma / Myanmar in Bowling Green, KY are:
What zip code has the Highest Percentage of Immigrants from Burma / Myanmar in Bowling Green, KY?
42104 has the Highest Percentage of Immigrants from Burma / Myanmar in Bowling Green, KY with 1.78%.
What is the Percentage of Immigrants from Burma / Myanmar in Bowling Green, KY?
Percentage of Immigrants from Burma / Myanmar in Bowling Green is 2.53%.
What is the Percentage of Immigrants from Burma / Myanmar in Kentucky?
Percentage of Immigrants from Burma / Myanmar in Kentucky is 0.077%.
What is the Percentage of Immigrants from Burma / Myanmar in the United States?
Percentage of Immigrants from Burma / Myanmar in the United States is 0.047%.