Zip Codes with the Highest Percentage of Population with a Degree in Visual and Performing Arts in Bowling Green, KY
RELATED REPORTS & OPTIONS
Visual and Performing Arts
Bowling Green
Compare Zip Codes
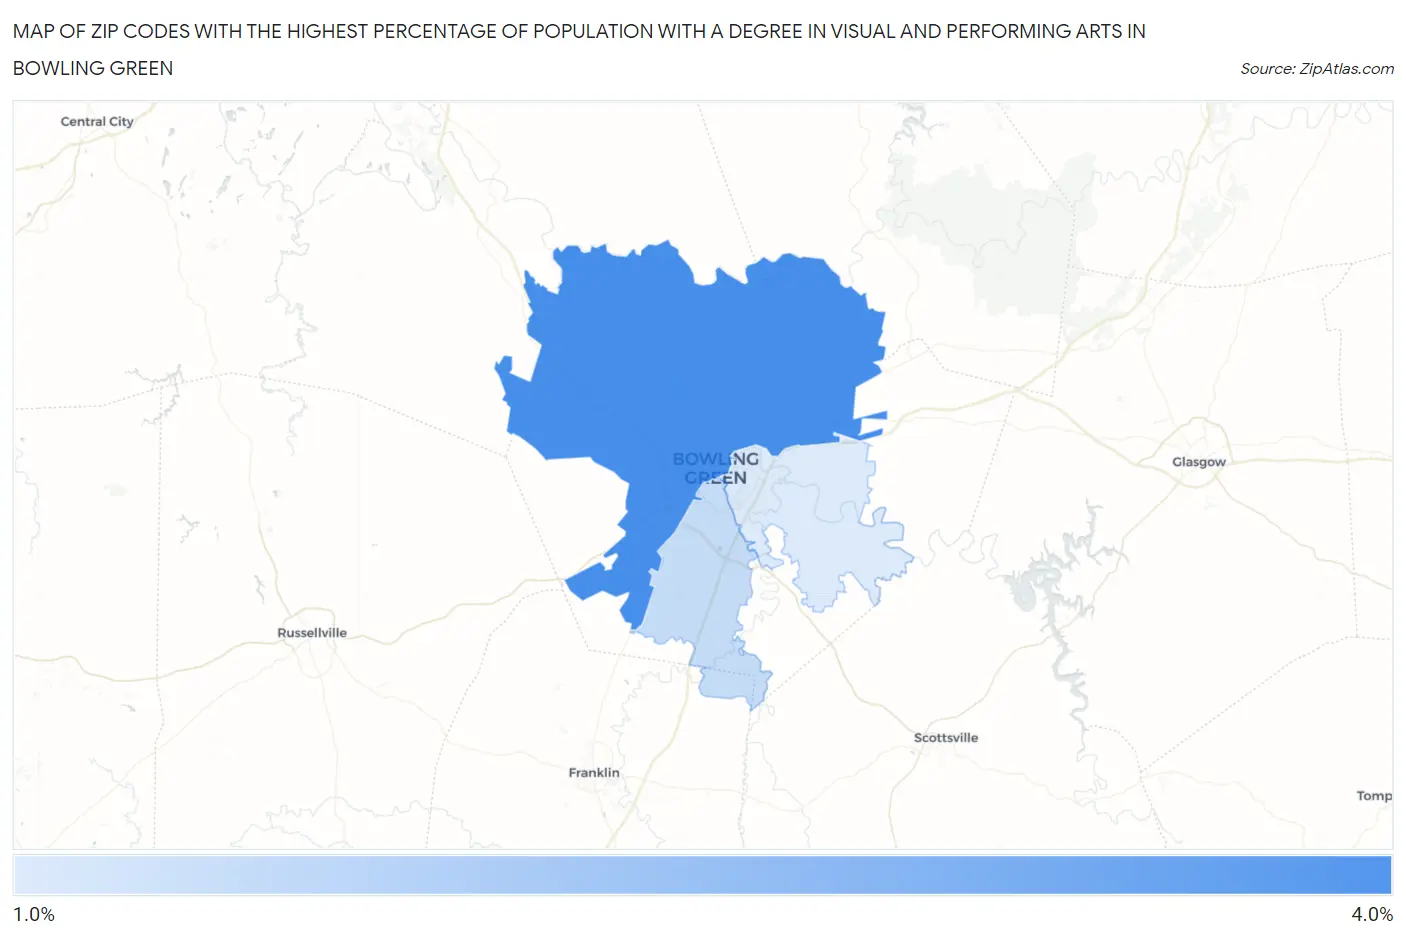
Map of Zip Codes with the Highest Percentage of Population with a Degree in Visual and Performing Arts in Bowling Green
1.8%
3.8%
Zip Codes with the Highest Percentage of Population with a Degree in Visual and Performing Arts in Bowling Green, KY
| Zip Code | % Graduates | vs State | vs National | |
| 1. | 42101 | 3.8% | 3.2%(+0.608)#119 | 4.3%(-0.415)#9,773 |
| 2. | 42104 | 2.1% | 3.2%(-1.11)#196 | 4.3%(-2.13)#16,000 |
| 3. | 42103 | 1.8% | 3.2%(-1.41)#221 | 4.3%(-2.43)#17,065 |
1
Common Questions
What are the Top Zip Codes with the Highest Percentage of Population with a Degree in Visual and Performing Arts in Bowling Green, KY?
Top Zip Codes with the Highest Percentage of Population with a Degree in Visual and Performing Arts in Bowling Green, KY are:
What zip code has the Highest Percentage of Population with a Degree in Visual and Performing Arts in Bowling Green, KY?
42101 has the Highest Percentage of Population with a Degree in Visual and Performing Arts in Bowling Green, KY with 3.8%.
What is the Percentage of Population with a Degree in Visual and Performing Arts in Bowling Green, KY?
Percentage of Population with a Degree in Visual and Performing Arts in Bowling Green is 2.6%.
What is the Percentage of Population with a Degree in Visual and Performing Arts in Kentucky?
Percentage of Population with a Degree in Visual and Performing Arts in Kentucky is 3.2%.
What is the Percentage of Population with a Degree in Visual and Performing Arts in the United States?
Percentage of Population with a Degree in Visual and Performing Arts in the United States is 4.3%.