Zip Codes with the Highest Percentage of Households Residing in Detached Homes in Bowling Green, KY
RELATED REPORTS & OPTIONS
Detached Home Residency
Bowling Green
Compare Zip Codes
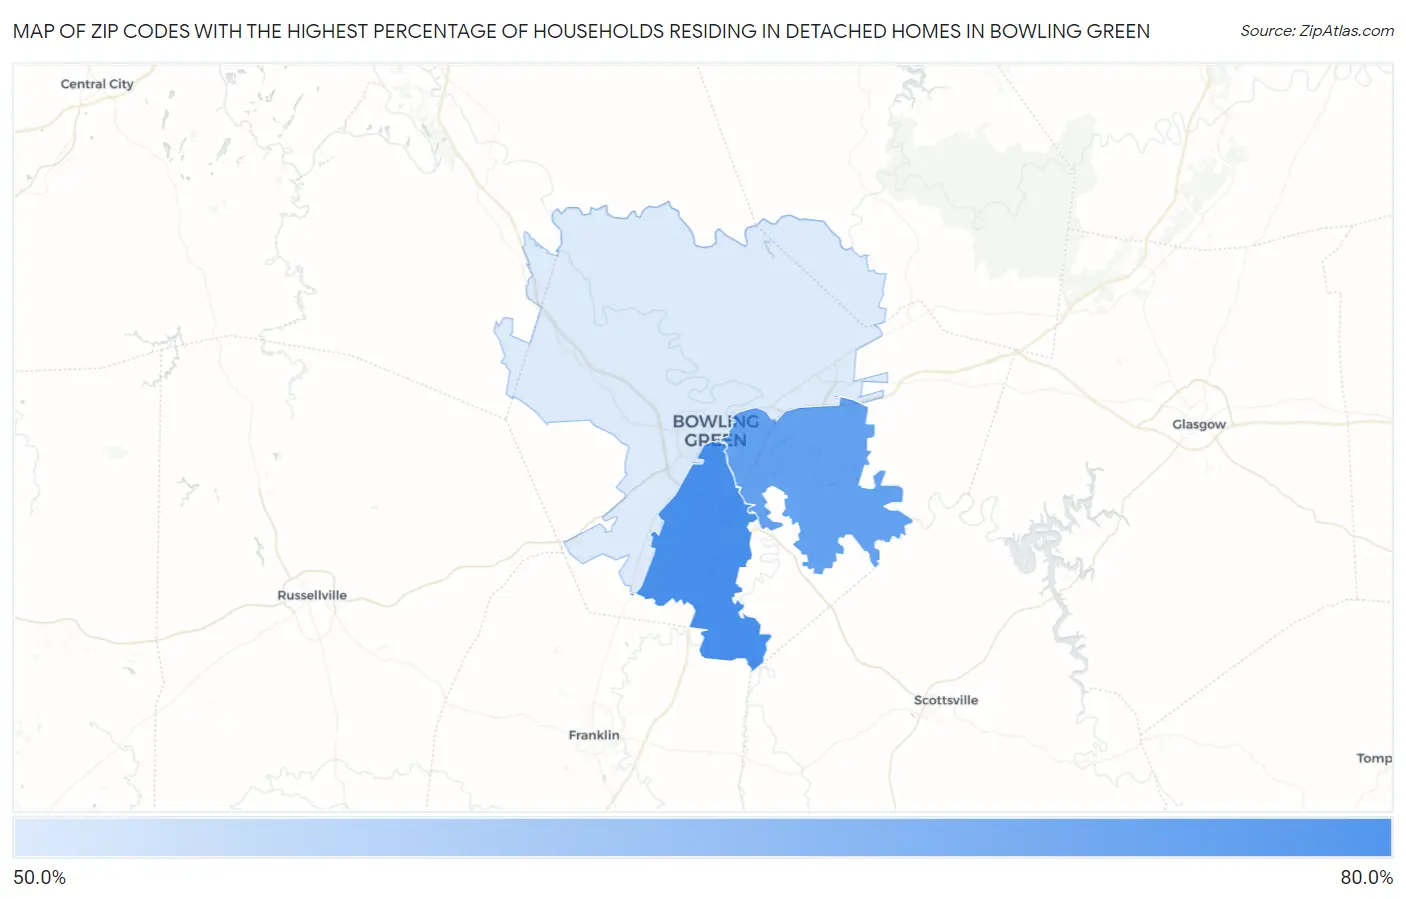
Map of Zip Codes with the Highest Percentage of Households Residing in Detached Homes in Bowling Green
56.3%
67.2%
Zip Codes with the Highest Percentage of Households Residing in Detached Homes in Bowling Green, KY
| Zip Code | Detached Home Residency | vs State | vs National | |
| 1. | 42104 | 67.2% | 69.1%(-1.90)#469 | 62.5%(+4.70)#23,263 |
| 2. | 42103 | 65.2% | 69.1%(-3.90)#502 | 62.5%(+2.70)#24,354 |
| 3. | 42101 | 56.3% | 69.1%(-12.8)#611 | 62.5%(-6.20)#27,705 |
1
Common Questions
What are the Top Zip Codes with the Highest Percentage of Households Residing in Detached Homes in Bowling Green, KY?
Top Zip Codes with the Highest Percentage of Households Residing in Detached Homes in Bowling Green, KY are:
What zip code has the Highest Percentage of Households Residing in Detached Homes in Bowling Green, KY?
42104 has the Highest Percentage of Households Residing in Detached Homes in Bowling Green, KY with 67.2%.
What is the Percentage of Households Residing in Detached Homes in Bowling Green, KY?
Percentage of Households Residing in Detached Homes in Bowling Green is 47.2%.
What is the Percentage of Households Residing in Detached Homes in Kentucky?
Percentage of Households Residing in Detached Homes in Kentucky is 69.1%.
What is the Percentage of Households Residing in Detached Homes in the United States?
Percentage of Households Residing in Detached Homes in the United States is 62.5%.