Zip Codes with the Highest Percentage of Families with Income Below $10,000 in Bowling Green, KY
RELATED REPORTS & OPTIONS
Family Income | $0-10k
Bowling Green
Compare Zip Codes
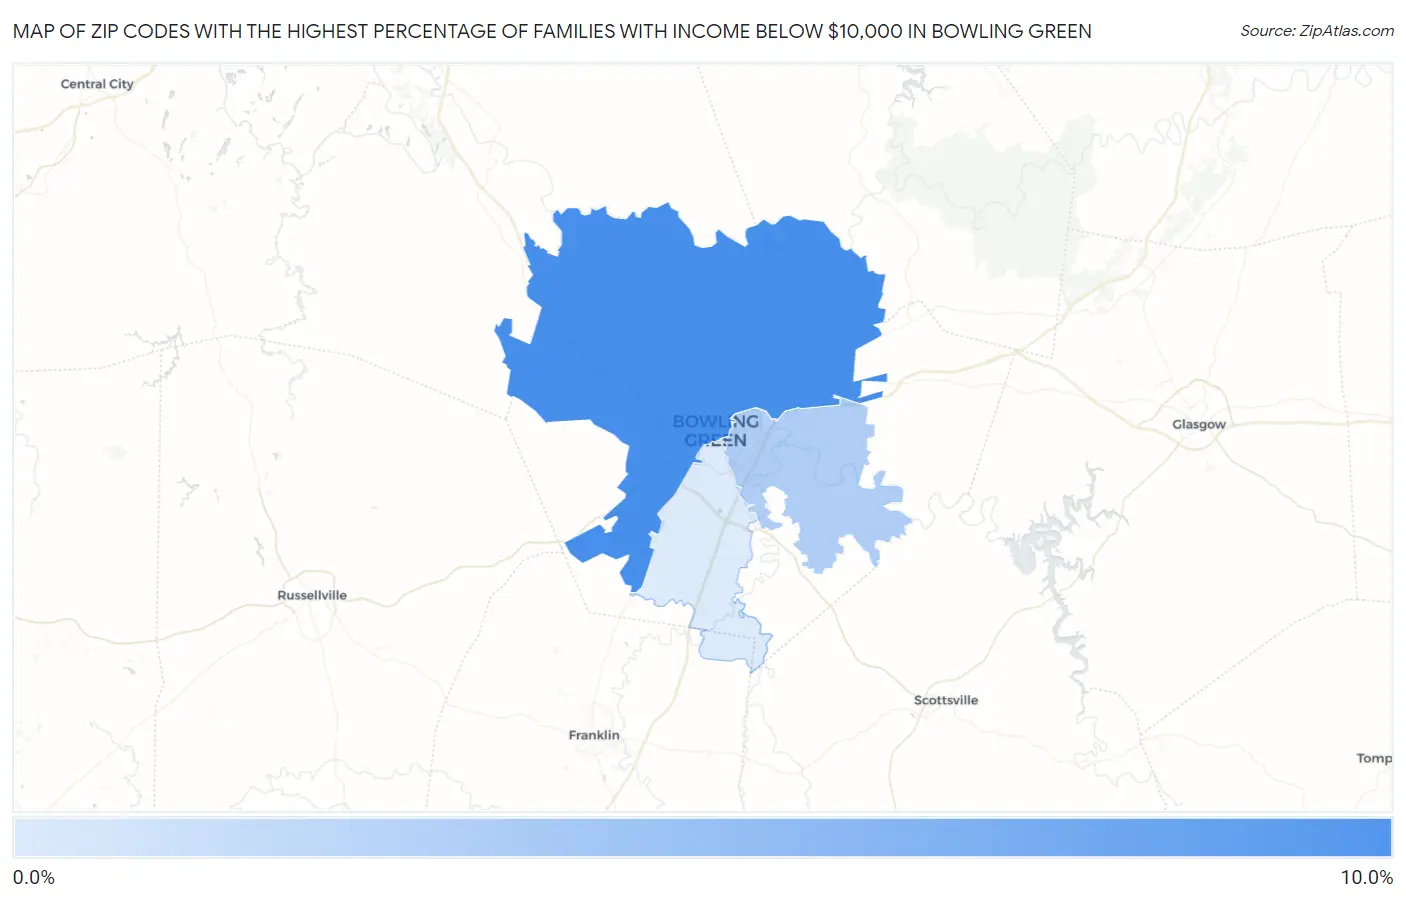
Map of Zip Codes with the Highest Percentage of Families with Income Below $10,000 in Bowling Green
1.2%
8.2%
Zip Codes with the Highest Percentage of Families with Income Below $10,000 in Bowling Green, KY
| Zip Code | Families with Income < $10k | vs State | vs National | |
| 1. | 42101 | 8.2% | 4.2%(+4.00)#136 | 3.1%(+5.10)#2,830 |
| 2. | 42103 | 3.3% | 4.2%(-0.900)#334 | 3.1%(+0.200)#10,169 |
| 3. | 42104 | 1.2% | 4.2%(-3.00)#458 | 3.1%(-1.90)#19,225 |
1
Common Questions
What are the Top Zip Codes with the Highest Percentage of Families with Income Below $10,000 in Bowling Green, KY?
Top Zip Codes with the Highest Percentage of Families with Income Below $10,000 in Bowling Green, KY are:
What zip code has the Highest Percentage of Families with Income Below $10,000 in Bowling Green, KY?
42101 has the Highest Percentage of Families with Income Below $10,000 in Bowling Green, KY with 8.2%.
What is the Percentage of Families with Income Below $10,000 in Bowling Green, KY?
Percentage of Families with Income Below $10,000 in Bowling Green is 7.3%.
What is the Percentage of Families with Income Below $10,000 in Kentucky?
Percentage of Families with Income Below $10,000 in Kentucky is 4.2%.
What is the Percentage of Families with Income Below $10,000 in the United States?
Percentage of Families with Income Below $10,000 in the United States is 3.1%.