Zip Codes with the Highest Percentage of Population Employed in Office & Administration in Bowling Green, KY
RELATED REPORTS & OPTIONS
Office & Administration
Bowling Green
Compare Zip Codes
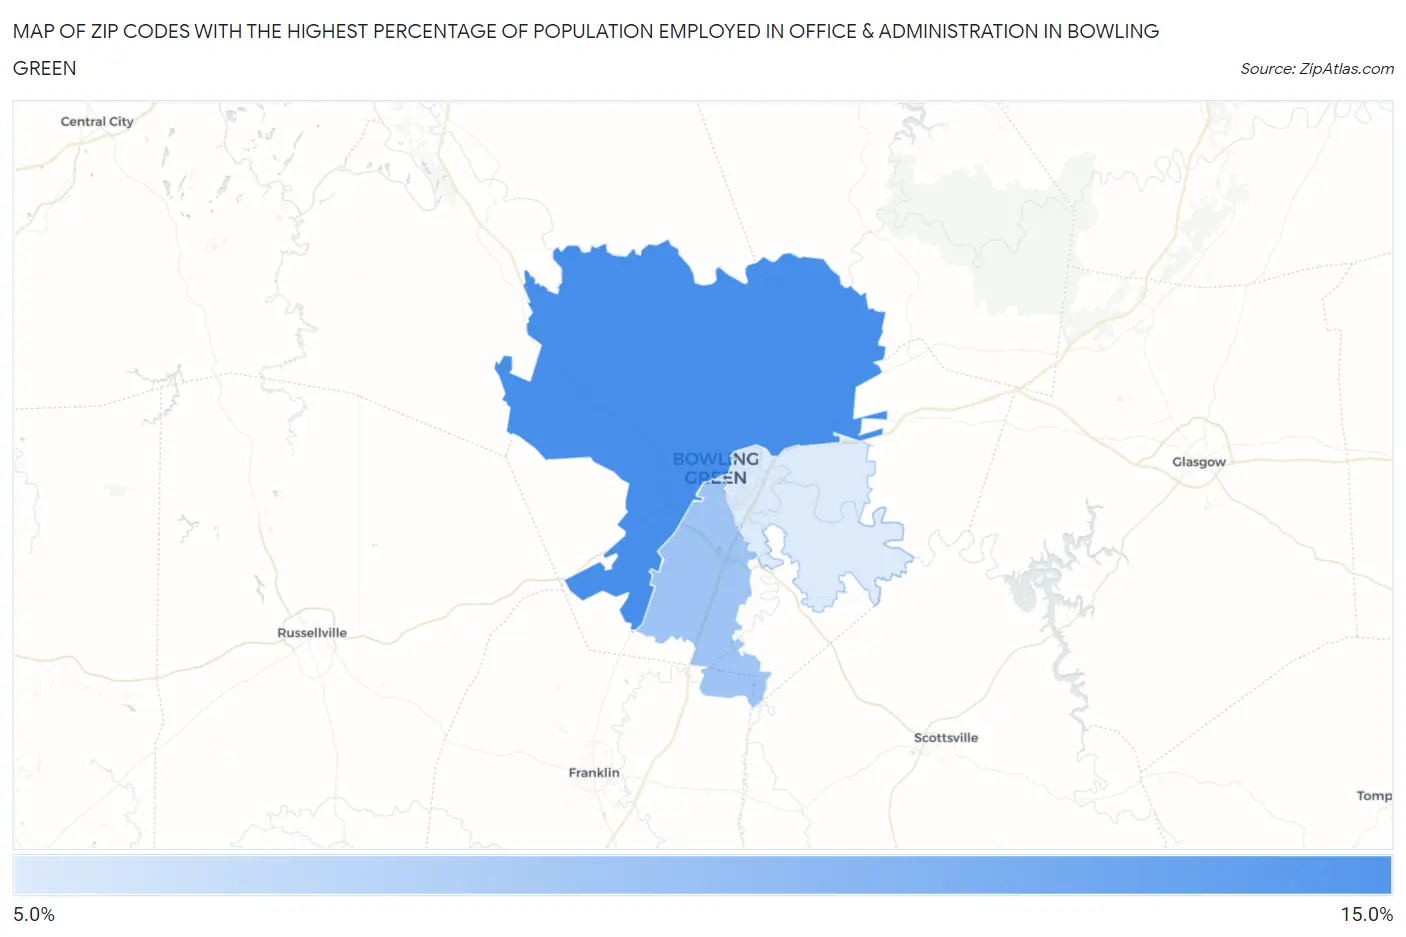
Map of Zip Codes with the Highest Percentage of Population Employed in Office & Administration in Bowling Green
9.1%
12.7%
Zip Codes with the Highest Percentage of Population Employed in Office & Administration in Bowling Green, KY
| Zip Code | % Employed | vs State | vs National | |
| 1. | 42101 | 12.7% | 11.4%(+1.30)#232 | 10.9%(+1.82)#8,845 |
| 2. | 42104 | 10.5% | 11.4%(-0.829)#350 | 10.9%(-0.309)#15,306 |
| 3. | 42103 | 9.1% | 11.4%(-2.30)#431 | 10.9%(-1.78)#20,030 |
1
Common Questions
What are the Top Zip Codes with the Highest Percentage of Population Employed in Office & Administration in Bowling Green, KY?
Top Zip Codes with the Highest Percentage of Population Employed in Office & Administration in Bowling Green, KY are:
What zip code has the Highest Percentage of Population Employed in Office & Administration in Bowling Green, KY?
42101 has the Highest Percentage of Population Employed in Office & Administration in Bowling Green, KY with 12.7%.
What is the Percentage of Population Employed in Office & Administration in Bowling Green, KY?
Percentage of Population Employed in Office & Administration in Bowling Green is 11.1%.
What is the Percentage of Population Employed in Office & Administration in Kentucky?
Percentage of Population Employed in Office & Administration in Kentucky is 11.4%.
What is the Percentage of Population Employed in Office & Administration in the United States?
Percentage of Population Employed in Office & Administration in the United States is 10.9%.