Zip Codes with the Highest Percentage of Population with a Degree in Science and Engineering in Bowling Green, KY
RELATED REPORTS & OPTIONS
Science and Engineering
Bowling Green
Compare Zip Codes
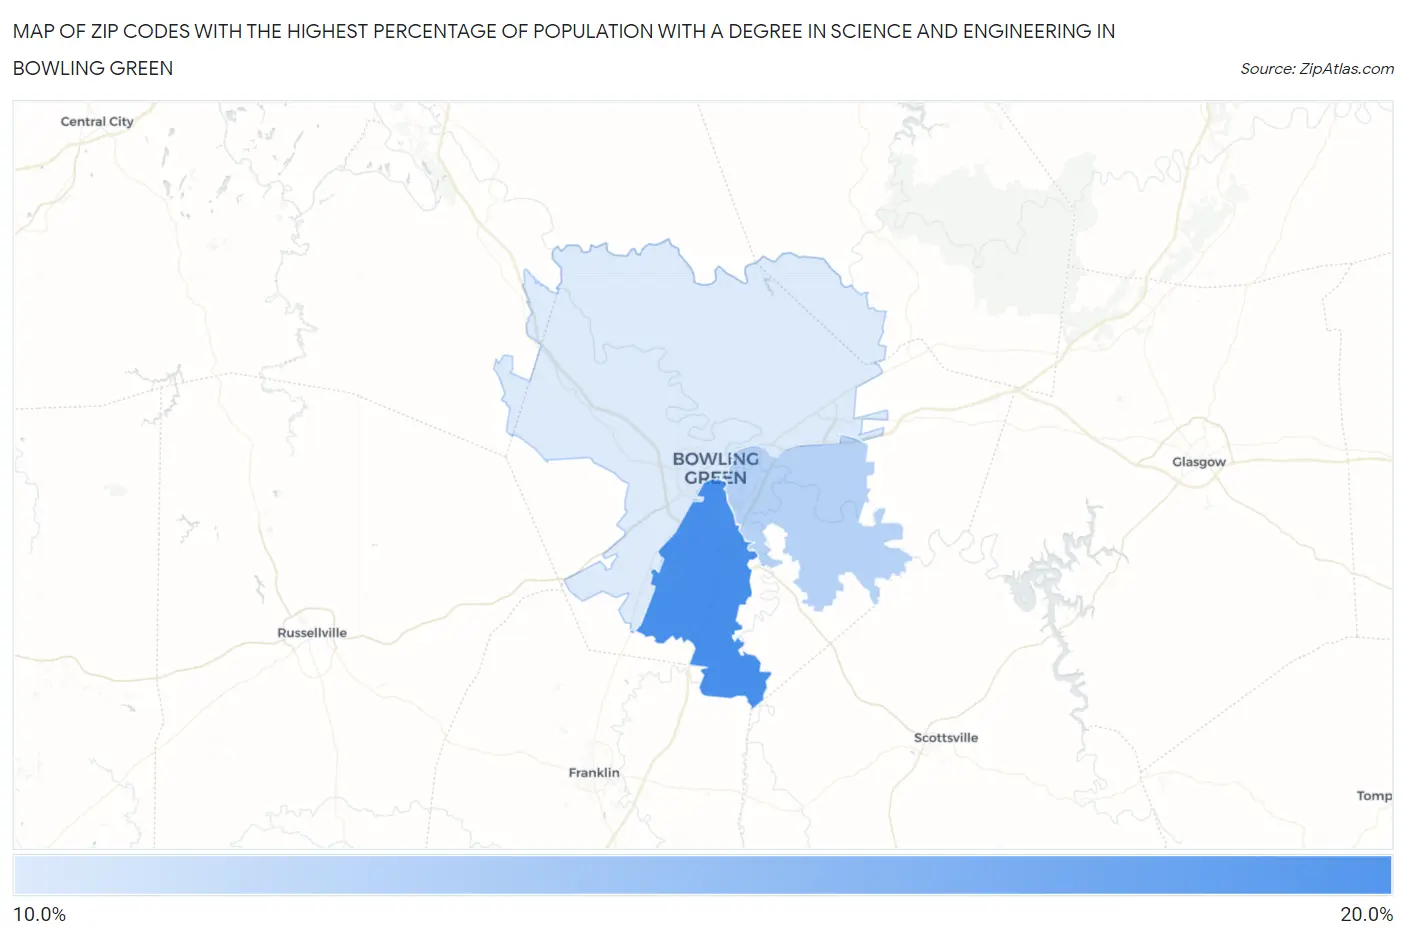
Map of Zip Codes with the Highest Percentage of Population with a Degree in Science and Engineering in Bowling Green
10.9%
15.9%
Zip Codes with the Highest Percentage of Population with a Degree in Science and Engineering in Bowling Green, KY
| Zip Code | % Graduates | vs State | vs National | |
| 1. | 42104 | 15.9% | 11.9%(+4.02)#190 | 9.8%(+6.09)#5,830 |
| 2. | 42103 | 12.1% | 11.9%(+0.294)#283 | 9.8%(+2.36)#10,646 |
| 3. | 42101 | 10.9% | 11.9%(-0.969)#335 | 9.8%(+1.10)#13,123 |
1
Common Questions
What are the Top Zip Codes with the Highest Percentage of Population with a Degree in Science and Engineering in Bowling Green, KY?
Top Zip Codes with the Highest Percentage of Population with a Degree in Science and Engineering in Bowling Green, KY are:
What zip code has the Highest Percentage of Population with a Degree in Science and Engineering in Bowling Green, KY?
42104 has the Highest Percentage of Population with a Degree in Science and Engineering in Bowling Green, KY with 15.9%.
What is the Percentage of Population with a Degree in Science and Engineering in Bowling Green, KY?
Percentage of Population with a Degree in Science and Engineering in Bowling Green is 15.3%.
What is the Percentage of Population with a Degree in Science and Engineering in Kentucky?
Percentage of Population with a Degree in Science and Engineering in Kentucky is 11.9%.
What is the Percentage of Population with a Degree in Science and Engineering in the United States?
Percentage of Population with a Degree in Science and Engineering in the United States is 9.8%.