Zip Codes with the Highest Percentage of Population Employed in Computer, Engineering & Science in Bowling Green, KY
RELATED REPORTS & OPTIONS
Computer, Engineering & Science
Bowling Green
Compare Zip Codes
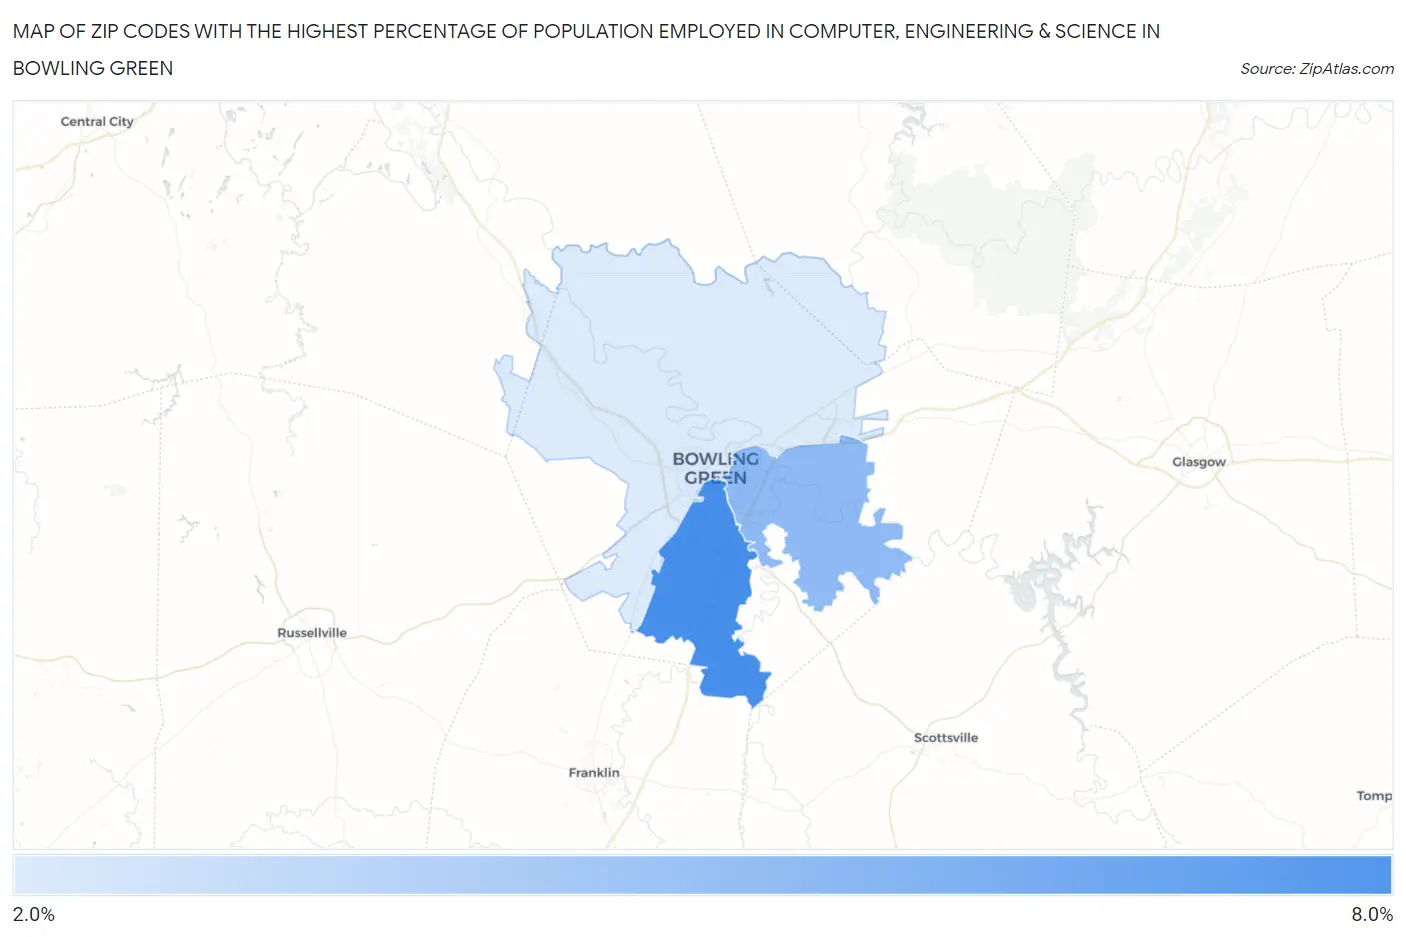
Map of Zip Codes with the Highest Percentage of Population Employed in Computer, Engineering & Science in Bowling Green
2.9%
6.1%
Zip Codes with the Highest Percentage of Population Employed in Computer, Engineering & Science in Bowling Green, KY
| Zip Code | % Employed | vs State | vs National | |
| 1. | 42104 | 6.1% | 4.6%(+1.47)#107 | 6.8%(-0.668)#8,602 |
| 2. | 42103 | 4.5% | 4.6%(-0.091)#163 | 6.8%(-2.23)#12,705 |
| 3. | 42101 | 2.9% | 4.6%(-1.72)#284 | 6.8%(-3.86)#18,463 |
1
Common Questions
What are the Top Zip Codes with the Highest Percentage of Population Employed in Computer, Engineering & Science in Bowling Green, KY?
Top Zip Codes with the Highest Percentage of Population Employed in Computer, Engineering & Science in Bowling Green, KY are:
What zip code has the Highest Percentage of Population Employed in Computer, Engineering & Science in Bowling Green, KY?
42104 has the Highest Percentage of Population Employed in Computer, Engineering & Science in Bowling Green, KY with 6.1%.
What is the Percentage of Population Employed in Computer, Engineering & Science in Bowling Green, KY?
Percentage of Population Employed in Computer, Engineering & Science in Bowling Green is 3.8%.
What is the Percentage of Population Employed in Computer, Engineering & Science in Kentucky?
Percentage of Population Employed in Computer, Engineering & Science in Kentucky is 4.6%.
What is the Percentage of Population Employed in Computer, Engineering & Science in the United States?
Percentage of Population Employed in Computer, Engineering & Science in the United States is 6.8%.