Zip Codes with the Highest Percentage of Population Employed in Sales & Related in Bowling Green, KY
RELATED REPORTS & OPTIONS
Sales & Related
Bowling Green
Compare Zip Codes
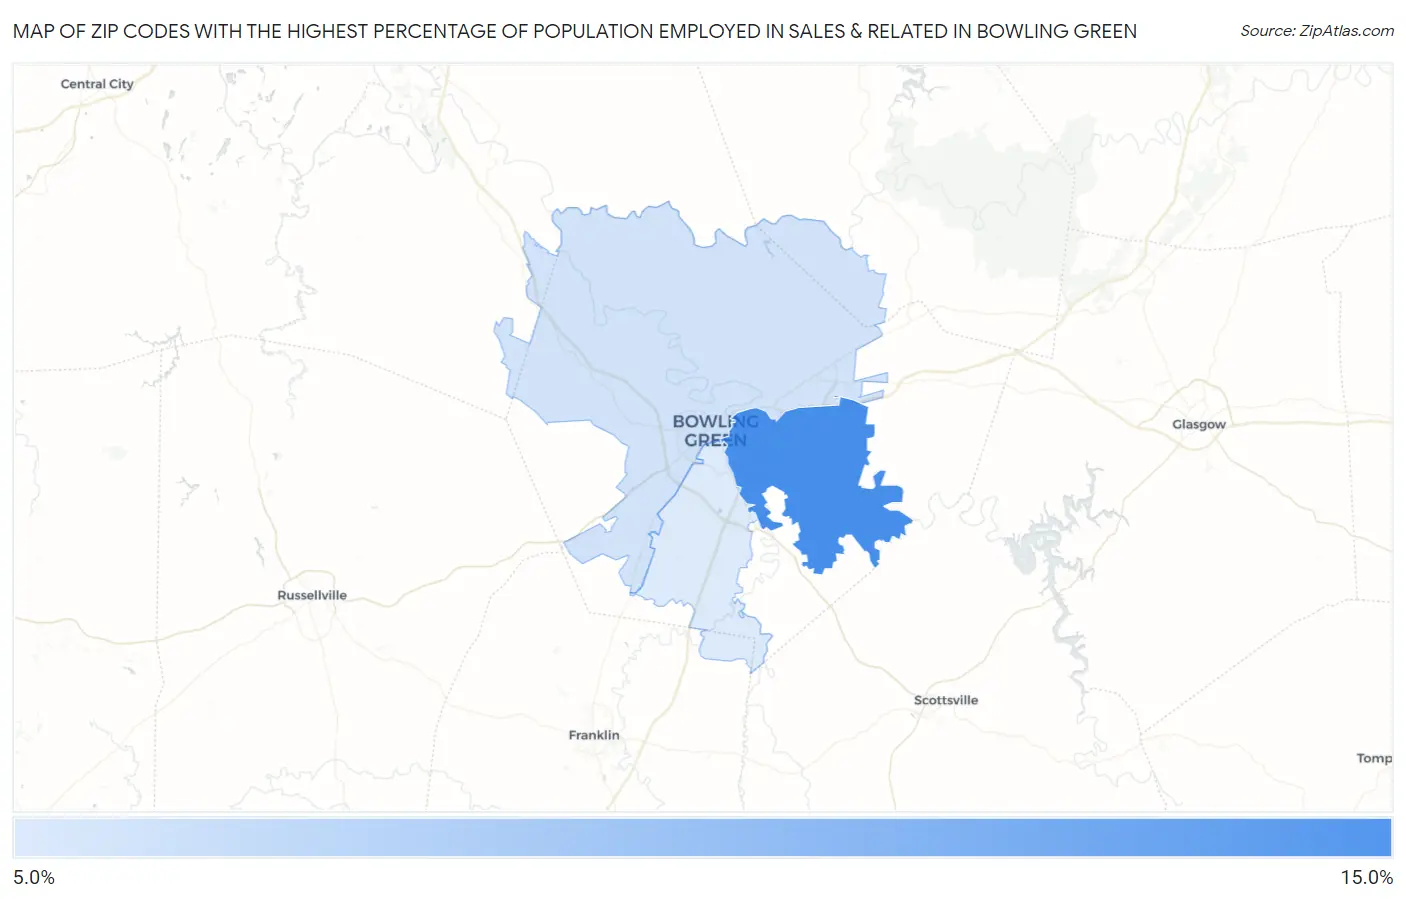
Map of Zip Codes with the Highest Percentage of Population Employed in Sales & Related in Bowling Green
9.7%
11.8%
Zip Codes with the Highest Percentage of Population Employed in Sales & Related in Bowling Green, KY
| Zip Code | % Employed | vs State | vs National | |
| 1. | 42103 | 11.8% | 9.2%(+2.64)#151 | 9.6%(+2.25)#6,324 |
| 2. | 42101 | 9.8% | 9.2%(+0.626)#235 | 9.6%(+0.244)#11,508 |
| 3. | 42104 | 9.7% | 9.2%(+0.455)#246 | 9.6%(+0.073)#12,146 |
1
Common Questions
What are the Top Zip Codes with the Highest Percentage of Population Employed in Sales & Related in Bowling Green, KY?
Top Zip Codes with the Highest Percentage of Population Employed in Sales & Related in Bowling Green, KY are:
What zip code has the Highest Percentage of Population Employed in Sales & Related in Bowling Green, KY?
42103 has the Highest Percentage of Population Employed in Sales & Related in Bowling Green, KY with 11.8%.
What is the Percentage of Population Employed in Sales & Related in Bowling Green, KY?
Percentage of Population Employed in Sales & Related in Bowling Green is 10.6%.
What is the Percentage of Population Employed in Sales & Related in Kentucky?
Percentage of Population Employed in Sales & Related in Kentucky is 9.2%.
What is the Percentage of Population Employed in Sales & Related in the United States?
Percentage of Population Employed in Sales & Related in the United States is 9.6%.