Zip Codes with the Highest Percentage of Population Employed in Professional & Scientific Services in Bowling Green, KY
RELATED REPORTS & OPTIONS
Professional & Scientific Services
Bowling Green
Compare Zip Codes
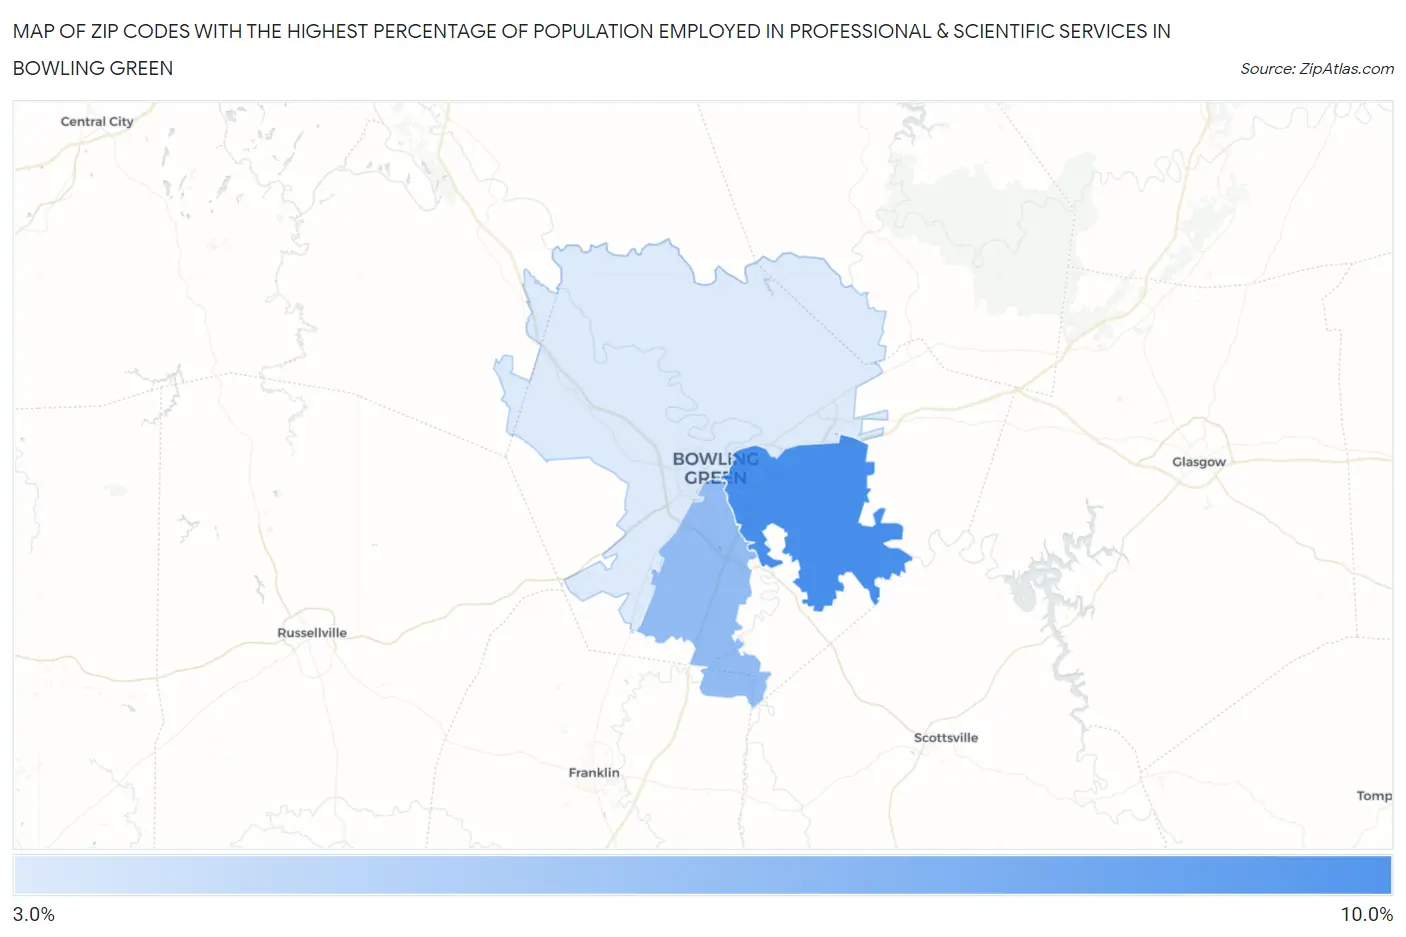
Map of Zip Codes with the Highest Percentage of Population Employed in Professional & Scientific Services in Bowling Green
3.9%
8.1%
Zip Codes with the Highest Percentage of Population Employed in Professional & Scientific Services in Bowling Green, KY
| Zip Code | % Employed | vs State | vs National | |
| 1. | 42103 | 8.1% | 4.9%(+3.21)#55 | 7.8%(+0.285)#6,496 |
| 2. | 42104 | 6.0% | 4.9%(+1.10)#102 | 7.8%(-1.82)#9,938 |
| 3. | 42101 | 3.9% | 4.9%(-1.01)#187 | 7.8%(-3.94)#15,389 |
1
Common Questions
What are the Top Zip Codes with the Highest Percentage of Population Employed in Professional & Scientific Services in Bowling Green, KY?
Top Zip Codes with the Highest Percentage of Population Employed in Professional & Scientific Services in Bowling Green, KY are:
What zip code has the Highest Percentage of Population Employed in Professional & Scientific Services in Bowling Green, KY?
42103 has the Highest Percentage of Population Employed in Professional & Scientific Services in Bowling Green, KY with 8.1%.
What is the Percentage of Population Employed in Professional & Scientific Services in Bowling Green, KY?
Percentage of Population Employed in Professional & Scientific Services in Bowling Green is 5.0%.
What is the Percentage of Population Employed in Professional & Scientific Services in Kentucky?
Percentage of Population Employed in Professional & Scientific Services in Kentucky is 4.9%.
What is the Percentage of Population Employed in Professional & Scientific Services in the United States?
Percentage of Population Employed in Professional & Scientific Services in the United States is 7.8%.