Zip Codes with the Highest Percentage of Population Employed in Computer & Mathematics in Palatine, IL
RELATED REPORTS & OPTIONS
Computer & Mathematics
Palatine
Compare Zip Codes
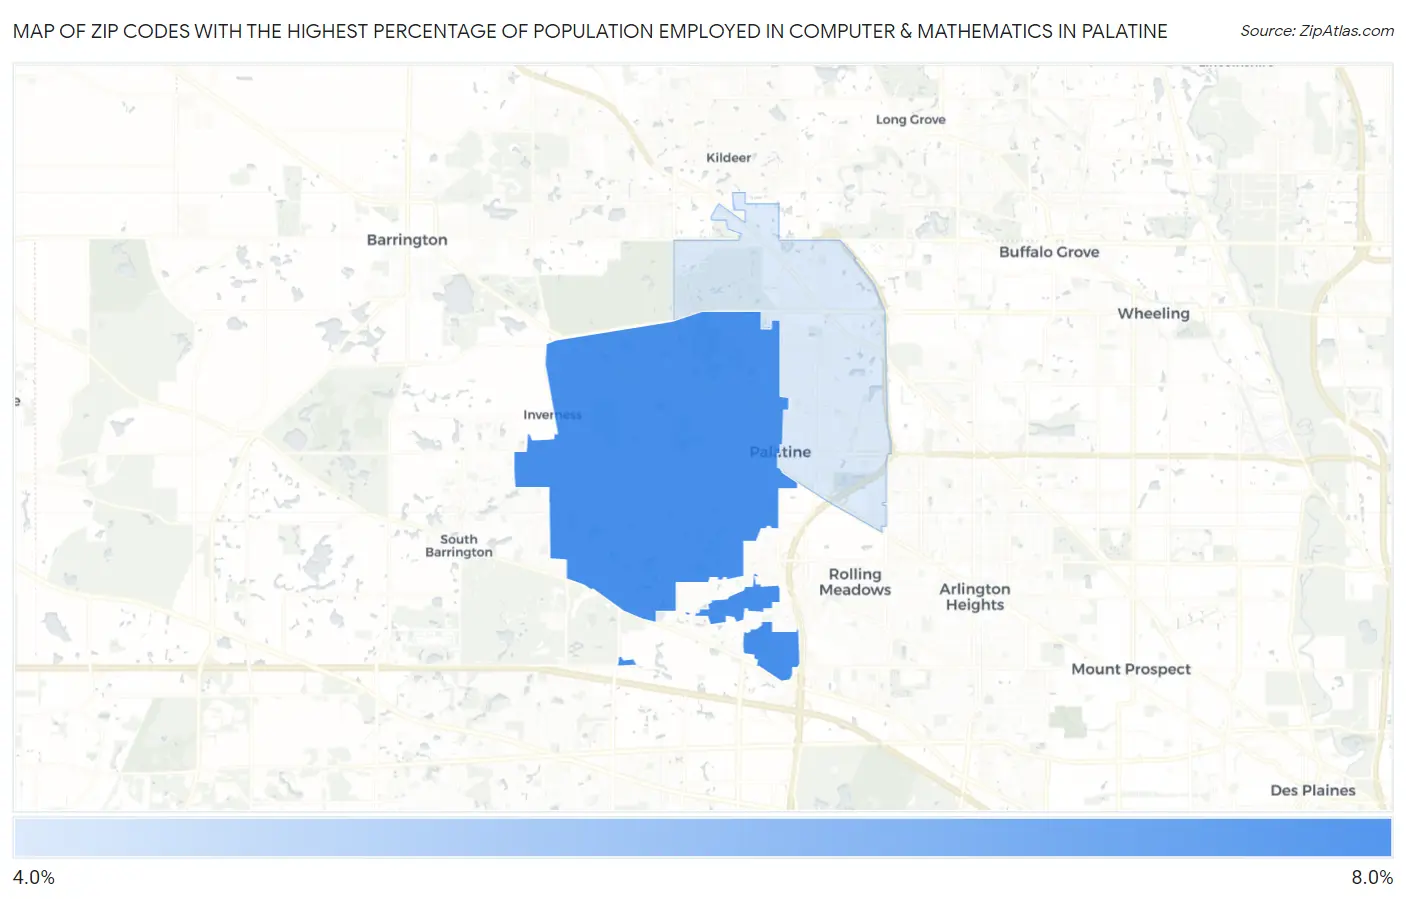
Map of Zip Codes with the Highest Percentage of Population Employed in Computer & Mathematics in Palatine
4.8%
6.5%
Zip Codes with the Highest Percentage of Population Employed in Computer & Mathematics in Palatine, IL
| Zip Code | % Employed | vs State | vs National | |
| 1. | 60067 | 6.5% | 3.6%(+2.92)#77 | 3.5%(+2.95)#1,945 |
| 2. | 60074 | 4.8% | 3.6%(+1.23)#157 | 3.5%(+1.27)#3,650 |
1
Common Questions
What are the Top Zip Codes with the Highest Percentage of Population Employed in Computer & Mathematics in Palatine, IL?
Top Zip Codes with the Highest Percentage of Population Employed in Computer & Mathematics in Palatine, IL are:
What zip code has the Highest Percentage of Population Employed in Computer & Mathematics in Palatine, IL?
60067 has the Highest Percentage of Population Employed in Computer & Mathematics in Palatine, IL with 6.5%.
What is the Percentage of Population Employed in Computer & Mathematics in Palatine, IL?
Percentage of Population Employed in Computer & Mathematics in Palatine is 5.8%.
What is the Percentage of Population Employed in Computer & Mathematics in Illinois?
Percentage of Population Employed in Computer & Mathematics in Illinois is 3.6%.
What is the Percentage of Population Employed in Computer & Mathematics in the United States?
Percentage of Population Employed in Computer & Mathematics in the United States is 3.5%.