Zip Codes with the Highest Percentage of Population with a Degree in Visual and Performing Arts in Palatine, IL
RELATED REPORTS & OPTIONS
Visual and Performing Arts
Palatine
Compare Zip Codes
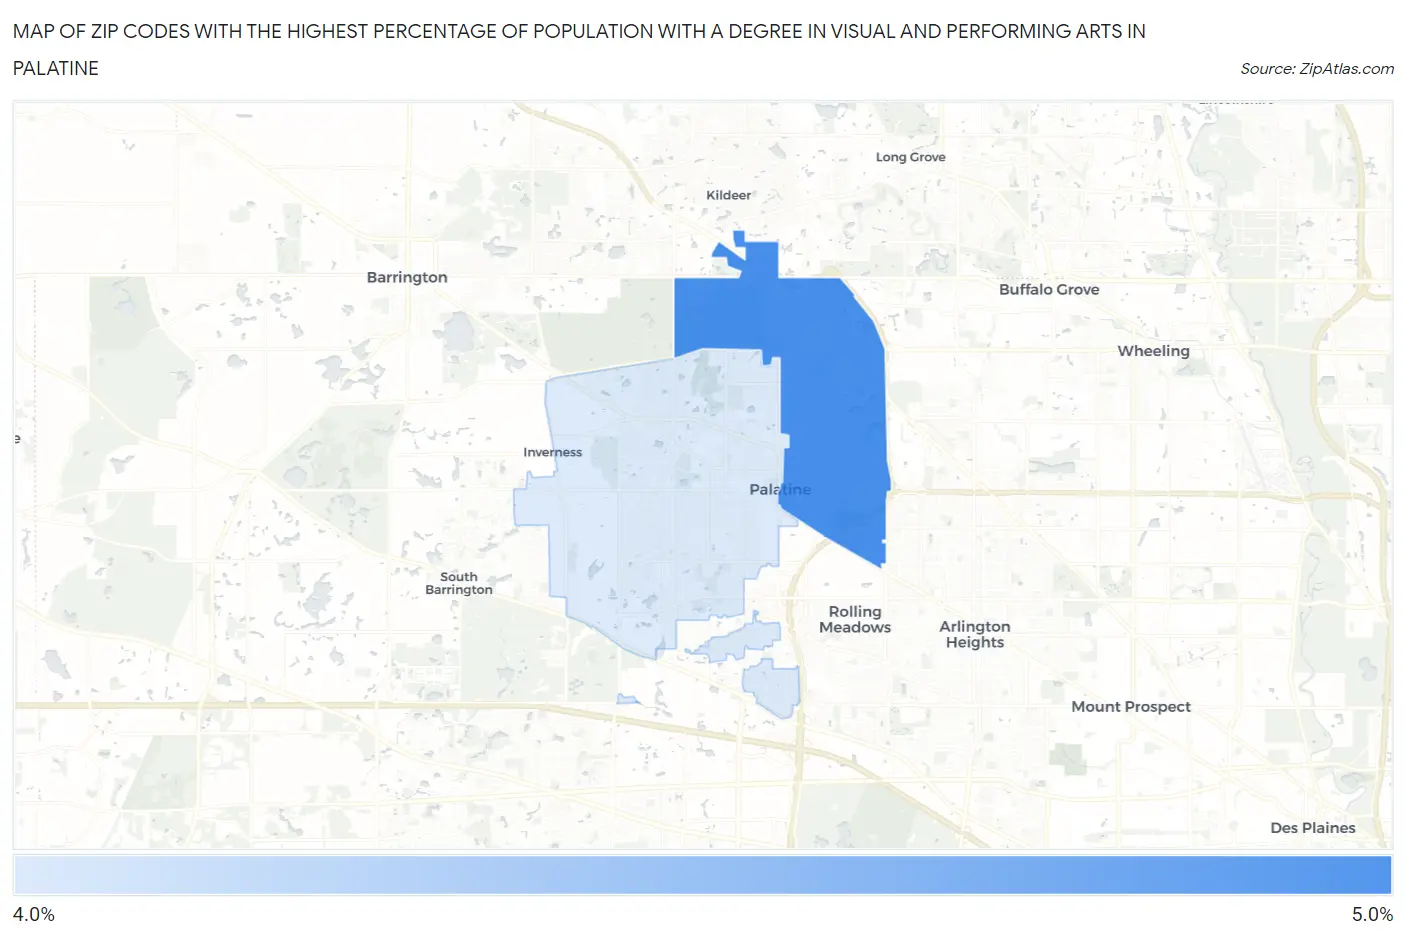
Map of Zip Codes with the Highest Percentage of Population with a Degree in Visual and Performing Arts in Palatine
4.2%
4.9%
Zip Codes with the Highest Percentage of Population with a Degree in Visual and Performing Arts in Palatine, IL
| Zip Code | % Graduates | vs State | vs National | |
| 1. | 60074 | 4.9% | 4.4%(+0.408)#256 | 4.3%(+0.606)#6,954 |
| 2. | 60067 | 4.2% | 4.4%(-0.245)#340 | 4.3%(-0.048)#8,611 |
1
Common Questions
What are the Top Zip Codes with the Highest Percentage of Population with a Degree in Visual and Performing Arts in Palatine, IL?
Top Zip Codes with the Highest Percentage of Population with a Degree in Visual and Performing Arts in Palatine, IL are:
What zip code has the Highest Percentage of Population with a Degree in Visual and Performing Arts in Palatine, IL?
60074 has the Highest Percentage of Population with a Degree in Visual and Performing Arts in Palatine, IL with 4.9%.
What is the Percentage of Population with a Degree in Visual and Performing Arts in Palatine, IL?
Percentage of Population with a Degree in Visual and Performing Arts in Palatine is 4.7%.
What is the Percentage of Population with a Degree in Visual and Performing Arts in Illinois?
Percentage of Population with a Degree in Visual and Performing Arts in Illinois is 4.4%.
What is the Percentage of Population with a Degree in Visual and Performing Arts in the United States?
Percentage of Population with a Degree in Visual and Performing Arts in the United States is 4.3%.