Zip Codes with the Highest Percentage of Population Employed in Architecture & Engineering in Palatine, IL
RELATED REPORTS & OPTIONS
Architecture & Engineering
Palatine
Compare Zip Codes
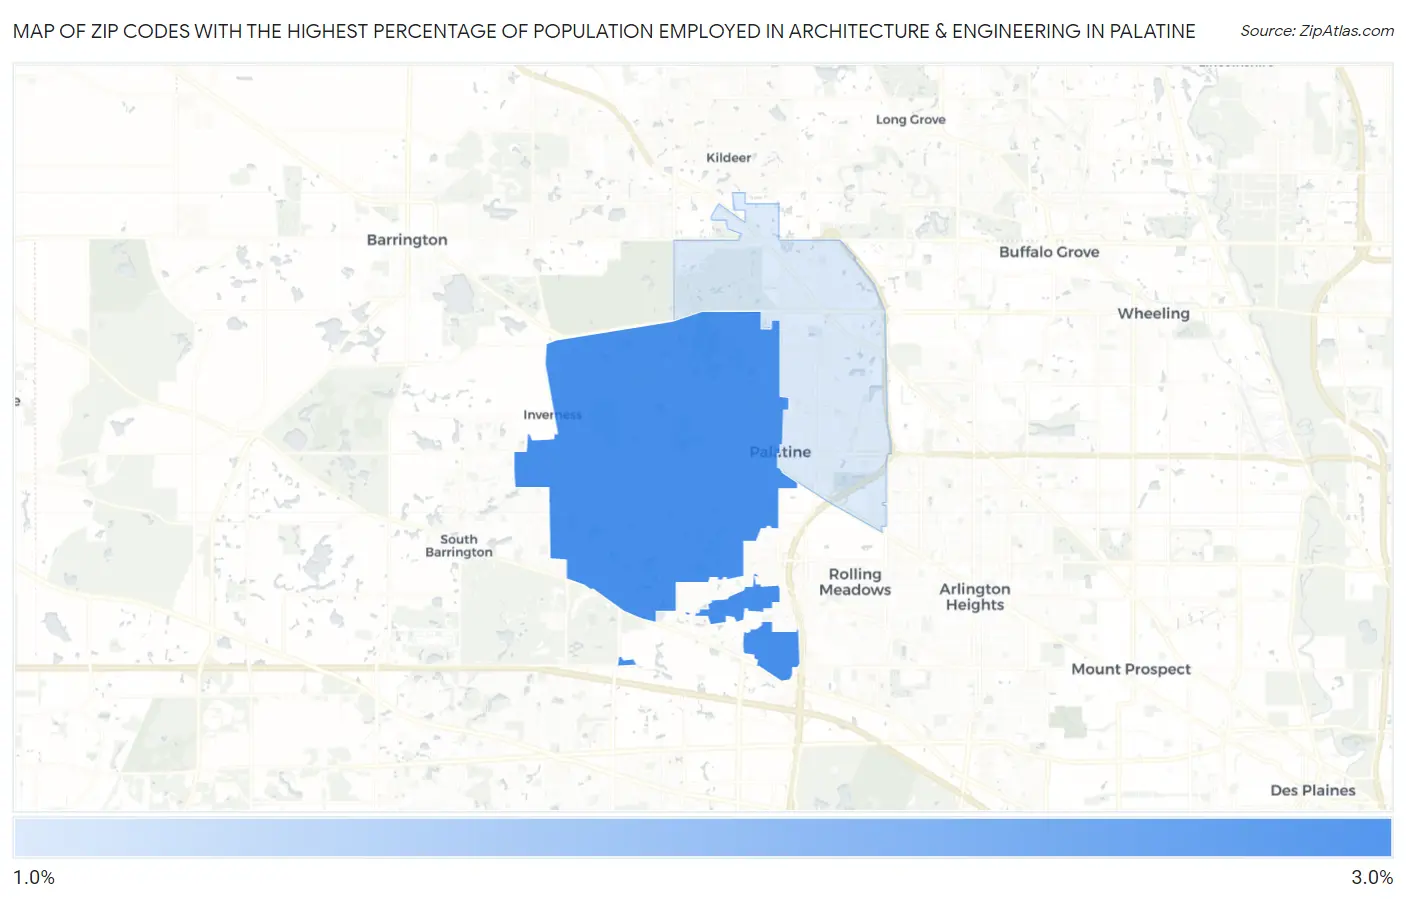
Map of Zip Codes with the Highest Percentage of Population Employed in Architecture & Engineering in Palatine
1.8%
2.7%
Zip Codes with the Highest Percentage of Population Employed in Architecture & Engineering in Palatine, IL
| Zip Code | % Employed | vs State | vs National | |
| 1. | 60067 | 2.7% | 1.9%(+0.832)#231 | 2.1%(+0.578)#6,057 |
| 2. | 60074 | 1.8% | 1.9%(-0.049)#440 | 2.1%(-0.304)#10,579 |
1
Common Questions
What are the Top Zip Codes with the Highest Percentage of Population Employed in Architecture & Engineering in Palatine, IL?
Top Zip Codes with the Highest Percentage of Population Employed in Architecture & Engineering in Palatine, IL are:
What zip code has the Highest Percentage of Population Employed in Architecture & Engineering in Palatine, IL?
60067 has the Highest Percentage of Population Employed in Architecture & Engineering in Palatine, IL with 2.7%.
What is the Percentage of Population Employed in Architecture & Engineering in Palatine, IL?
Percentage of Population Employed in Architecture & Engineering in Palatine is 2.2%.
What is the Percentage of Population Employed in Architecture & Engineering in Illinois?
Percentage of Population Employed in Architecture & Engineering in Illinois is 1.9%.
What is the Percentage of Population Employed in Architecture & Engineering in the United States?
Percentage of Population Employed in Architecture & Engineering in the United States is 2.1%.