Zip Codes with the Highest Percentage of Population Employed in Legal Services & Support in Palatine, IL
RELATED REPORTS & OPTIONS
Legal Services & Support
Palatine
Compare Zip Codes
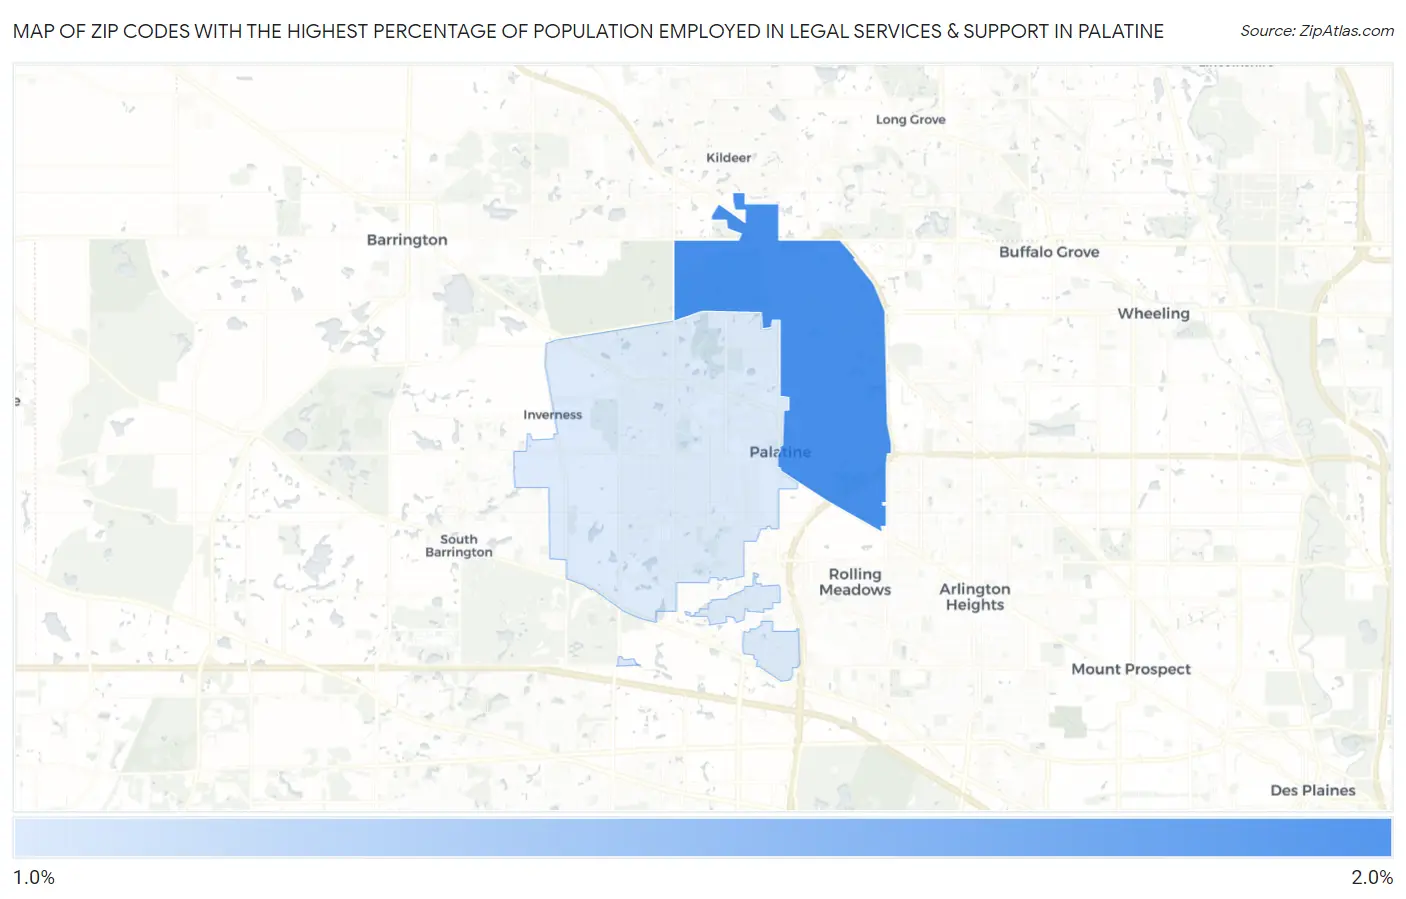
Map of Zip Codes with the Highest Percentage of Population Employed in Legal Services & Support in Palatine
1.1%
1.7%
Zip Codes with the Highest Percentage of Population Employed in Legal Services & Support in Palatine, IL
| Zip Code | % Employed | vs State | vs National | |
| 1. | 60074 | 1.7% | 1.3%(+0.305)#167 | 1.2%(+0.470)#4,477 |
| 2. | 60067 | 1.1% | 1.3%(-0.266)#267 | 1.2%(-0.101)#7,281 |
1
Common Questions
What are the Top Zip Codes with the Highest Percentage of Population Employed in Legal Services & Support in Palatine, IL?
Top Zip Codes with the Highest Percentage of Population Employed in Legal Services & Support in Palatine, IL are:
What zip code has the Highest Percentage of Population Employed in Legal Services & Support in Palatine, IL?
60074 has the Highest Percentage of Population Employed in Legal Services & Support in Palatine, IL with 1.7%.
What is the Percentage of Population Employed in Legal Services & Support in Palatine, IL?
Percentage of Population Employed in Legal Services & Support in Palatine is 1.3%.
What is the Percentage of Population Employed in Legal Services & Support in Illinois?
Percentage of Population Employed in Legal Services & Support in Illinois is 1.3%.
What is the Percentage of Population Employed in Legal Services & Support in the United States?
Percentage of Population Employed in Legal Services & Support in the United States is 1.2%.