Zip Codes with the Highest Percentage of Population Employed in Legal Services & Support in Carbondale, IL
RELATED REPORTS & OPTIONS
Legal Services & Support
Carbondale
Compare Zip Codes
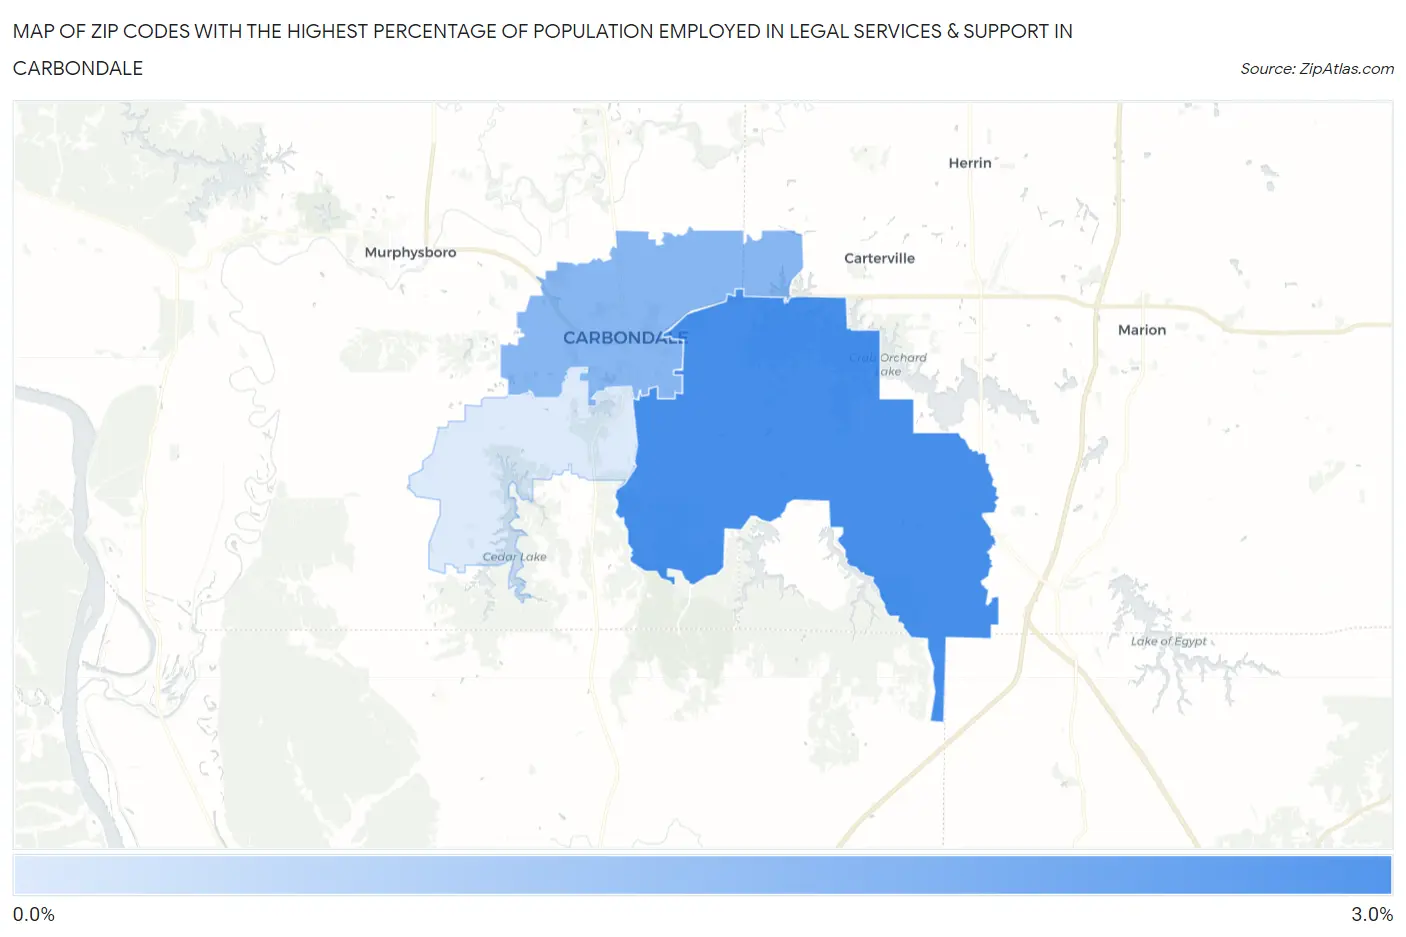
Map of Zip Codes with the Highest Percentage of Population Employed in Legal Services & Support in Carbondale
0.59%
2.8%
Zip Codes with the Highest Percentage of Population Employed in Legal Services & Support in Carbondale, IL
| Zip Code | % Employed | vs State | vs National | |
| 1. | 62902 | 2.8% | 1.3%(+1.40)#77 | 1.2%(+1.57)#2,133 |
| 2. | 62901 | 1.8% | 1.3%(+0.476)#154 | 1.2%(+0.641)#3,925 |
| 3. | 62903 | 0.59% | 1.3%(-0.756)#450 | 1.2%(-0.590)#11,530 |
1
Common Questions
What are the Top Zip Codes with the Highest Percentage of Population Employed in Legal Services & Support in Carbondale, IL?
Top Zip Codes with the Highest Percentage of Population Employed in Legal Services & Support in Carbondale, IL are:
What zip code has the Highest Percentage of Population Employed in Legal Services & Support in Carbondale, IL?
62902 has the Highest Percentage of Population Employed in Legal Services & Support in Carbondale, IL with 2.8%.
What is the Percentage of Population Employed in Legal Services & Support in Carbondale, IL?
Percentage of Population Employed in Legal Services & Support in Carbondale is 1.3%.
What is the Percentage of Population Employed in Legal Services & Support in Illinois?
Percentage of Population Employed in Legal Services & Support in Illinois is 1.3%.
What is the Percentage of Population Employed in Legal Services & Support in the United States?
Percentage of Population Employed in Legal Services & Support in the United States is 1.2%.