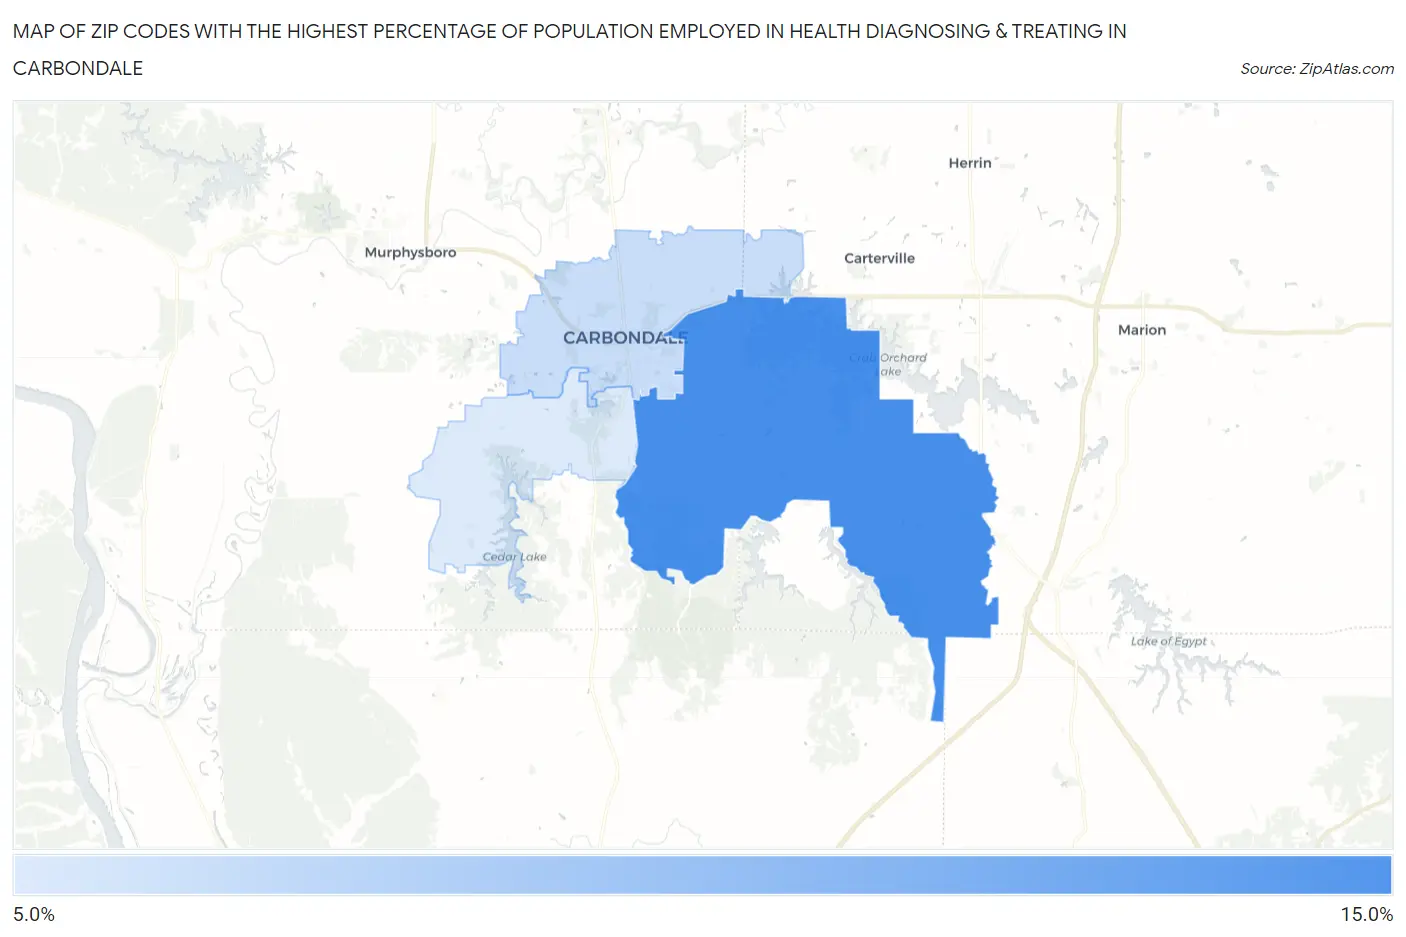
Zip Codes with the Highest Percentage of Population Employed in Health Diagnosing & Treating in Carbondale, IL
RELATED REPORTS & OPTIONS
Health Diagnosing & Treating
Carbondale
Compare Zip Codes
Map of Zip Codes with the Highest Percentage of Population Employed in Health Diagnosing & Treating in Carbondale
5.1%
11.6%
Zip Codes with the Highest Percentage of Population Employed in Health Diagnosing & Treating in Carbondale, IL
| Zip Code | % Employed | vs State | vs National | |
| 1. | 62902 | 11.6% | 6.2%(+5.41)#119 | 6.2%(+5.40)#2,418 |
| 2. | 62901 | 6.0% | 6.2%(-0.258)#651 | 6.2%(-0.267)#13,953 |
| 3. | 62903 | 5.1% | 6.2%(-1.12)#817 | 6.2%(-1.13)#17,264 |
1
Common Questions
What are the Top Zip Codes with the Highest Percentage of Population Employed in Health Diagnosing & Treating in Carbondale, IL?
Top Zip Codes with the Highest Percentage of Population Employed in Health Diagnosing & Treating in Carbondale, IL are:
What zip code has the Highest Percentage of Population Employed in Health Diagnosing & Treating in Carbondale, IL?
62902 has the Highest Percentage of Population Employed in Health Diagnosing & Treating in Carbondale, IL with 11.6%.
What is the Percentage of Population Employed in Health Diagnosing & Treating in Carbondale, IL?
Percentage of Population Employed in Health Diagnosing & Treating in Carbondale is 5.7%.
What is the Percentage of Population Employed in Health Diagnosing & Treating in Illinois?
Percentage of Population Employed in Health Diagnosing & Treating in Illinois is 6.2%.
What is the Percentage of Population Employed in Health Diagnosing & Treating in the United States?
Percentage of Population Employed in Health Diagnosing & Treating in the United States is 6.2%.