Zip Codes with the Highest Percentage of Population Employed in Architecture & Engineering in Carbondale, IL
RELATED REPORTS & OPTIONS
Architecture & Engineering
Carbondale
Compare Zip Codes
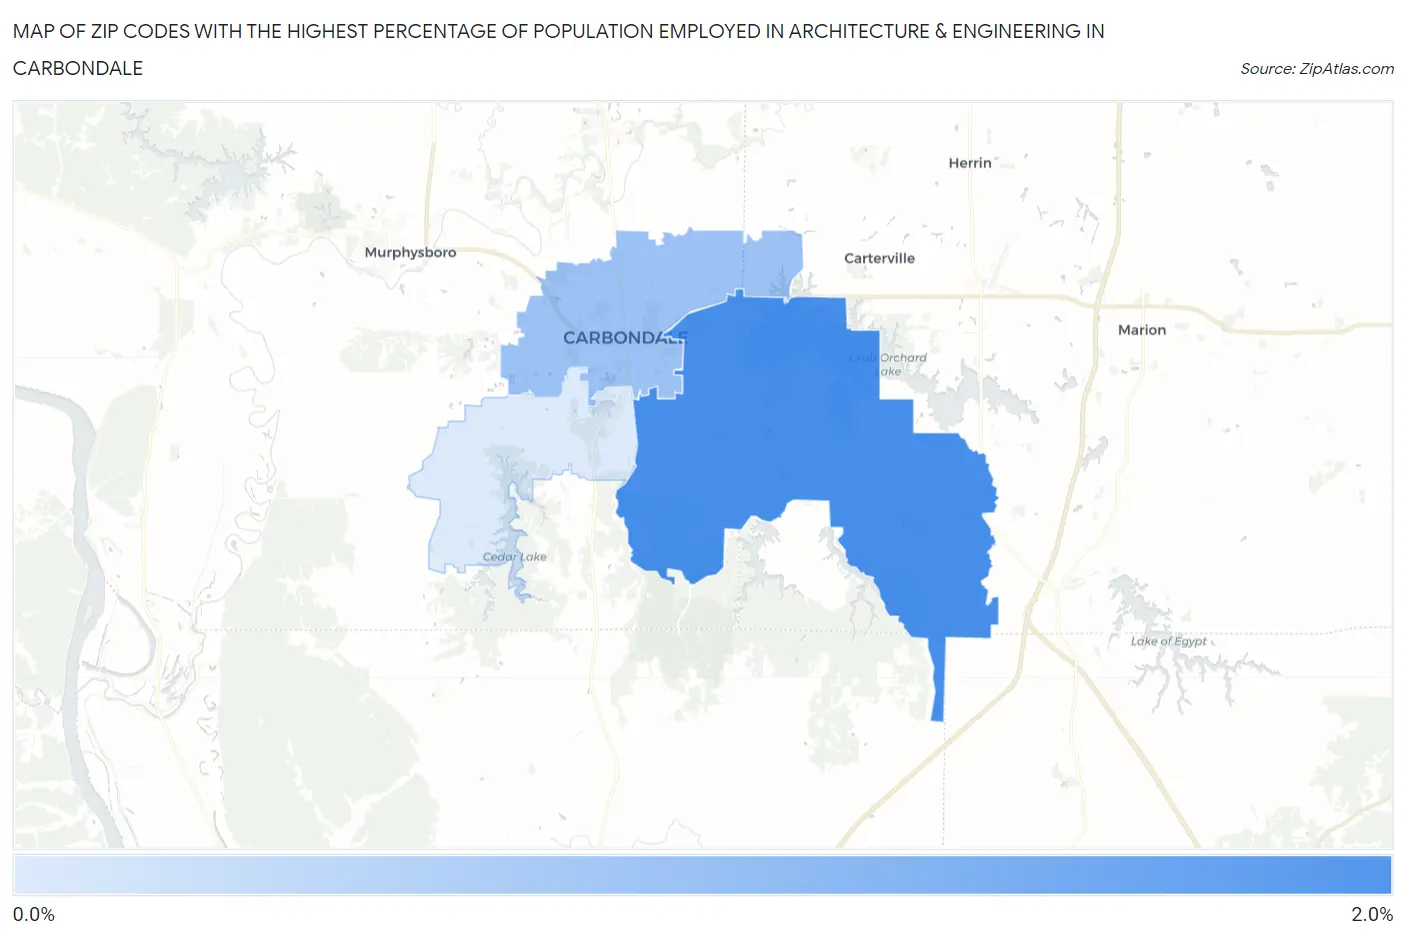
Map of Zip Codes with the Highest Percentage of Population Employed in Architecture & Engineering in Carbondale
0.45%
1.8%
Zip Codes with the Highest Percentage of Population Employed in Architecture & Engineering in Carbondale, IL
| Zip Code | % Employed | vs State | vs National | |
| 1. | 62902 | 1.8% | 1.9%(-0.139)#473 | 2.1%(-0.394)#11,104 |
| 2. | 62901 | 1.0% | 1.9%(-0.859)#691 | 2.1%(-1.11)#16,352 |
| 3. | 62903 | 0.45% | 1.9%(-1.45)#901 | 2.1%(-1.70)#20,616 |
1
Common Questions
What are the Top Zip Codes with the Highest Percentage of Population Employed in Architecture & Engineering in Carbondale, IL?
Top Zip Codes with the Highest Percentage of Population Employed in Architecture & Engineering in Carbondale, IL are:
What zip code has the Highest Percentage of Population Employed in Architecture & Engineering in Carbondale, IL?
62902 has the Highest Percentage of Population Employed in Architecture & Engineering in Carbondale, IL with 1.8%.
What is the Percentage of Population Employed in Architecture & Engineering in Carbondale, IL?
Percentage of Population Employed in Architecture & Engineering in Carbondale is 1.0%.
What is the Percentage of Population Employed in Architecture & Engineering in Illinois?
Percentage of Population Employed in Architecture & Engineering in Illinois is 1.9%.
What is the Percentage of Population Employed in Architecture & Engineering in the United States?
Percentage of Population Employed in Architecture & Engineering in the United States is 2.1%.