Romanian vs Immigrants from Norway Married-couple Households
COMPARE
Romanian
Immigrants from Norway
Married-couple Households
Married-couple Households Comparison
Romanians
Immigrants from Norway
48.4%
MARRIED-COUPLE HOUSEHOLDS
98.9/ 100
METRIC RATING
67th/ 347
METRIC RANK
46.5%
MARRIED-COUPLE HOUSEHOLDS
52.0/ 100
METRIC RATING
173rd/ 347
METRIC RANK
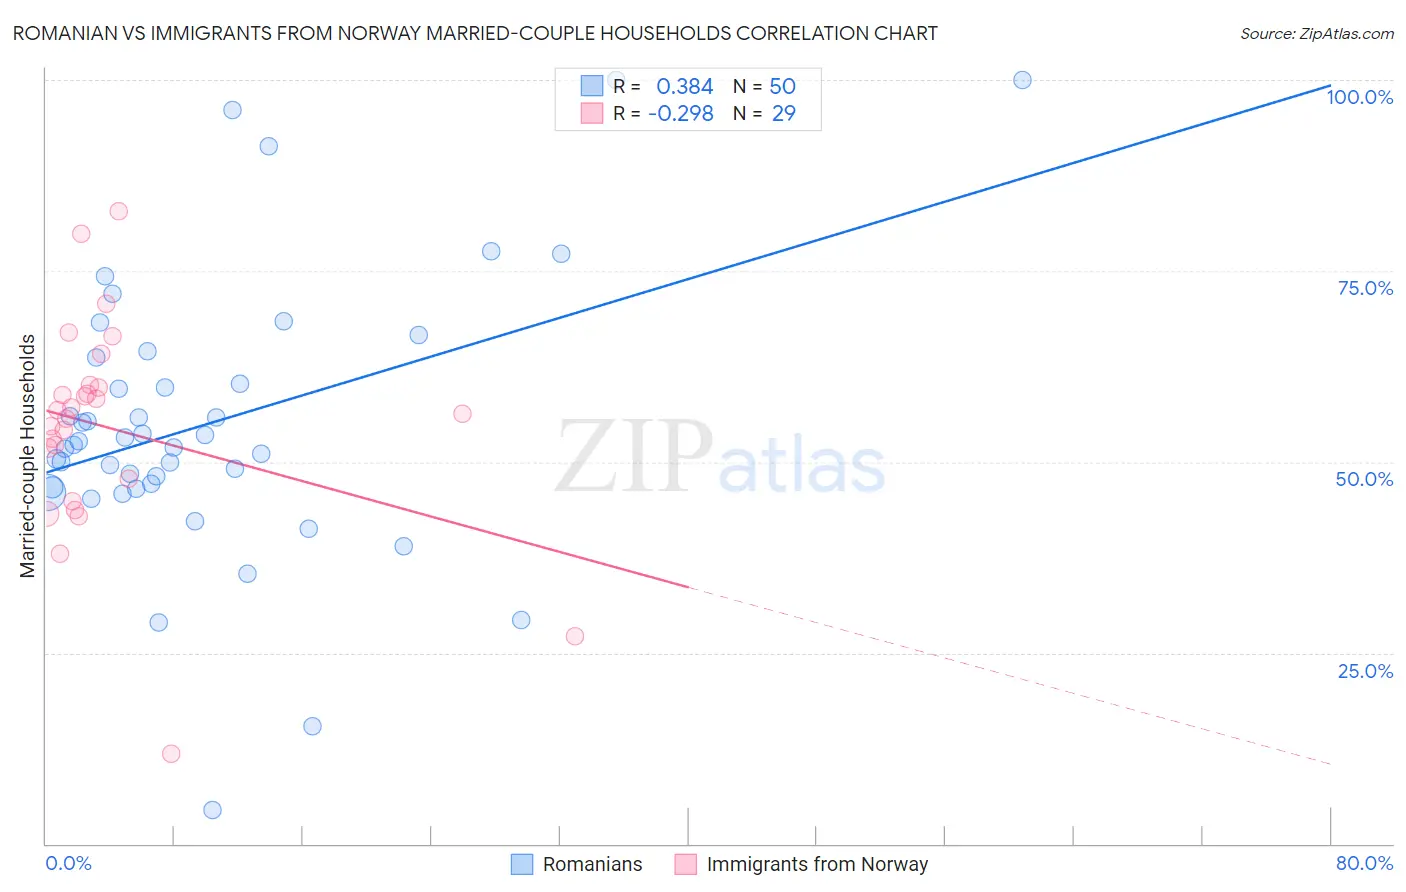
Romanian vs Immigrants from Norway Married-couple Households Correlation Chart
The statistical analysis conducted on geographies consisting of 377,697,282 people shows a mild positive correlation between the proportion of Romanians and percentage of married-couple family households in the United States with a correlation coefficient (R) of 0.384 and weighted average of 48.4%. Similarly, the statistical analysis conducted on geographies consisting of 116,686,104 people shows a weak negative correlation between the proportion of Immigrants from Norway and percentage of married-couple family households in the United States with a correlation coefficient (R) of -0.298 and weighted average of 46.5%, a difference of 4.2%.
Married-couple Households Correlation Summary
| Measurement | Romanian | Immigrants from Norway |
| Minimum | 4.5% | 11.8% |
| Maximum | 100.0% | 82.8% |
| Range | 95.5% | 71.0% |
| Mean | 55.1% | 54.3% |
| Median | 52.5% | 56.2% |
| Interquartile 25% (IQ1) | 46.7% | 46.3% |
| Interquartile 75% (IQ3) | 63.6% | 59.8% |
| Interquartile Range (IQR) | 17.0% | 13.6% |
| Standard Deviation (Sample) | 18.4% | 14.2% |
| Standard Deviation (Population) | 18.3% | 13.9% |
Similar Demographics by Married-couple Households
Demographics Similar to Romanians by Married-couple Households
In terms of married-couple households, the demographic groups most similar to Romanians are Jordanian (48.4%, a difference of 0.0%), Immigrants from South Eastern Asia (48.4%, a difference of 0.010%), Immigrants from China (48.4%, a difference of 0.010%), Immigrants from Canada (48.4%, a difference of 0.030%), and Northern European (48.4%, a difference of 0.050%).
| Demographics | Rating | Rank | Married-couple Households |
| Croatians | 99.1 /100 | #60 | Exceptional 48.5% |
| Bulgarians | 99.1 /100 | #61 | Exceptional 48.5% |
| Luxembourgers | 99.1 /100 | #62 | Exceptional 48.5% |
| Basques | 99.0 /100 | #63 | Exceptional 48.4% |
| Northern Europeans | 99.0 /100 | #64 | Exceptional 48.4% |
| Immigrants | Canada | 99.0 /100 | #65 | Exceptional 48.4% |
| Jordanians | 98.9 /100 | #66 | Exceptional 48.4% |
| Romanians | 98.9 /100 | #67 | Exceptional 48.4% |
| Immigrants | South Eastern Asia | 98.9 /100 | #68 | Exceptional 48.4% |
| Immigrants | China | 98.9 /100 | #69 | Exceptional 48.4% |
| Immigrants | North America | 98.9 /100 | #70 | Exceptional 48.4% |
| Laotians | 98.8 /100 | #71 | Exceptional 48.4% |
| Scotch-Irish | 98.6 /100 | #72 | Exceptional 48.3% |
| Immigrants | Singapore | 98.6 /100 | #73 | Exceptional 48.3% |
| Immigrants | Romania | 98.6 /100 | #74 | Exceptional 48.3% |
Demographics Similar to Immigrants from Norway by Married-couple Households
In terms of married-couple households, the demographic groups most similar to Immigrants from Norway are Immigrants from Mexico (46.4%, a difference of 0.070%), Immigrants from Australia (46.5%, a difference of 0.10%), Immigrants from Chile (46.5%, a difference of 0.14%), Immigrants from Colombia (46.4%, a difference of 0.22%), and South American (46.6%, a difference of 0.23%).
| Demographics | Rating | Rank | Married-couple Households |
| Cherokee | 65.7 /100 | #166 | Good 46.7% |
| Immigrants | Croatia | 64.2 /100 | #167 | Good 46.7% |
| Israelis | 62.3 /100 | #168 | Good 46.7% |
| Spanish American Indians | 59.4 /100 | #169 | Average 46.6% |
| South Americans | 58.0 /100 | #170 | Average 46.6% |
| Immigrants | Chile | 55.7 /100 | #171 | Average 46.5% |
| Immigrants | Australia | 54.6 /100 | #172 | Average 46.5% |
| Immigrants | Norway | 52.0 /100 | #173 | Average 46.5% |
| Immigrants | Mexico | 50.0 /100 | #174 | Average 46.4% |
| Immigrants | Colombia | 46.1 /100 | #175 | Average 46.4% |
| Cajuns | 45.2 /100 | #176 | Average 46.4% |
| Immigrants | Immigrants | 43.8 /100 | #177 | Average 46.3% |
| Immigrants | Costa Rica | 43.4 /100 | #178 | Average 46.3% |
| Immigrants | Zimbabwe | 43.0 /100 | #179 | Average 46.3% |
| Mongolians | 42.0 /100 | #180 | Average 46.3% |