Romanian vs Lumbee Married-couple Households

COMPARE

Romanian
Race
Ancestry
AfghanAfricanAlaska NativeAlaskan AthabascanAlbanianAleutAlsatianAmericanApacheArabArapahoArgentineanArmenianAssyrian/Chaldean/SyriacAustralianAustrianBahamianBangladeshiBarbadianBasqueBelgianBelizeanBermudanBhutaneseBlackfeetBolivianBrazilianBritishBritish West IndianBulgarianBurmeseCajunCambodianCanadianCape VerdeanCarpatho RusynCelticCentral AmericanCentral American IndianCherokeeCheyenneChickasawChileanChineseChippewaChoctawColombianColvilleComancheCosta RicanCreeCreekCroatianCrowCubanCypriotCzechCzechoslovakianDanishDelawareDominicanDutchDutch West IndianEastern EuropeanEcuadorianEgyptianEnglishEstonianEthiopianEuropeanFijianFilipinoFinnishFrenchFrench American IndianFrench CanadianGermanGerman RussianGhanaianGreekGuamanian/ChamorroGuatemalanGuyaneseHaitianHmongHonduranHopiHoumaHungarianIcelanderIndian (Asian)IndonesianInupiatIranianIraqiIrishIroquoisIsraeliItalianJamaicanJapaneseJordanianKenyanKiowaKoreanLaotianLatvianLebaneseLiberianLithuanianLuxembourgerMacedonianMalaysianMalteseMarshalleseMenomineeMexicanMexican American IndianMongolianMoroccanNative HawaiianNavajoNepaleseNew ZealanderNicaraguanNigerianNorthern EuropeanNorwegianOkinawanOsageOttawaPaiutePakistaniPalestinianPanamanianParaguayanPennsylvania GermanPeruvianPimaPolishPortuguesePotawatomiPuebloPuerto RicanPuget Sound SalishRomanianRussianSalvadoranSamoanScandinavianScotch-IrishScottishSeminoleSenegaleseSerbianShoshoneSierra LeoneanSiouxSlavicSlovakSloveneSomaliSouth AfricanSouth AmericanSouth American IndianSoviet UnionSpaniardSpanishSpanish AmericanSpanish American IndianSri LankanSubsaharan AfricanSudaneseSwedishSwissSyrianTaiwaneseThaiTlingit-HaidaTohono O'OdhamTonganTrinidadian and TobagonianTsimshianTurkishU.S. Virgin IslanderUgandanUkrainianUruguayanUteVenezuelanVietnameseWelshWest IndianYakamaYaquiYugoslavianYumanYup'ikZimbabwean
Immigration
NonimmigrantsImmigrantsAfghanistanAfricaAlbaniaArgentinaArmeniaAsiaAustraliaAustriaBahamasBangladeshBarbadosBelarusBelgiumBelizeBoliviaBosnia and HerzegovinaBrazilBulgariaBurma/MyanmarCabo VerdeCambodiaCameroonCanadaCaribbeanCentral AmericaChileChinaColombiaCongoCosta RicaCroatiaCubaCzechoslovakiaDenmarkDominicaDominican RepublicEastern AfricaEastern AsiaEastern EuropeEcuadorEgyptEl SalvadorEnglandEritreaEthiopiaEuropeFijiFranceGermanyGhanaGreeceGrenadaGuatemalaGuyanaHaitiHondurasHong KongHungaryIndiaIndonesiaIranIraqIrelandIsraelItalyJamaicaJapanJordanKazakhstanKenyaKoreaKuwaitLaosLatin AmericaLatviaLebanonLiberiaLithuaniaMalaysiaMexicoMicronesiaMiddle AfricaMoldovaMoroccoNepalNetherlandsNicaraguaNigeriaNorth AmericaNorth MacedoniaNorthern AfricaNorthern EuropeNorwayOceaniaPakistanPanamaPeruPhilippinesPolandPortugalRomaniaRussiaSaudi ArabiaScotlandSenegalSerbiaSierra LeoneSingaporeSomaliaSouth AfricaSouth AmericaSouth Central AsiaSouth Eastern AsiaSouthern EuropeSpainSri LankaSt. Vincent and the GrenadinesSudanSwedenSwitzerlandSyriaTaiwanThailandTrinidad and TobagoTurkeyUgandaUkraineUruguayUzbekistanVenezuelaVietnamWest IndiesWestern AfricaWestern AsiaWestern EuropeYemenZaireZimbabweAzores
Lumbee
Race
Ancestry
AfghanAfricanAlaska NativeAlaskan AthabascanAlbanianAleutAlsatianAmericanApacheArabArapahoArgentineanArmenianAssyrian/Chaldean/SyriacAustralianAustrianBahamianBangladeshiBarbadianBasqueBelgianBelizeanBermudanBhutaneseBlackfeetBolivianBrazilianBritishBritish West IndianBulgarianBurmeseCajunCambodianCanadianCape VerdeanCarpatho RusynCelticCentral AmericanCentral American IndianCherokeeCheyenneChickasawChileanChineseChippewaChoctawColombianColvilleComancheCosta RicanCreeCreekCroatianCrowCubanCypriotCzechCzechoslovakianDanishDelawareDominicanDutchDutch West IndianEastern EuropeanEcuadorianEgyptianEnglishEstonianEthiopianEuropeanFijianFilipinoFinnishFrenchFrench American IndianFrench CanadianGermanGerman RussianGhanaianGreekGuamanian/ChamorroGuatemalanGuyaneseHaitianHmongHonduranHopiHoumaHungarianIcelanderIndian (Asian)IndonesianInupiatIranianIraqiIrishIroquoisIsraeliItalianJamaicanJapaneseJordanianKenyanKiowaKoreanLaotianLatvianLebaneseLiberianLithuanianLumbeeLuxembourgerMacedonianMalaysianMalteseMarshalleseMenomineeMexicanMexican American IndianMongolianMoroccanNative HawaiianNavajoNepaleseNew ZealanderNicaraguanNigerianNorthern EuropeanNorwegianOkinawanOsageOttawaPaiutePakistaniPalestinianPanamanianParaguayanPennsylvania GermanPeruvianPimaPolishPortuguesePotawatomiPuebloPuerto RicanPuget Sound SalishRussianSalvadoranSamoanScandinavianScotch-IrishScottishSeminoleSenegaleseSerbianShoshoneSierra LeoneanSiouxSlavicSlovakSloveneSomaliSouth AfricanSouth AmericanSouth American IndianSoviet UnionSpaniardSpanishSpanish AmericanSpanish American IndianSri LankanSubsaharan AfricanSudaneseSwedishSwissSyrianTaiwaneseThaiTlingit-HaidaTohono O'OdhamTonganTrinidadian and TobagonianTsimshianTurkishU.S. Virgin IslanderUgandanUkrainianUruguayanUteVenezuelanVietnameseWelshWest IndianYakamaYaquiYugoslavianYumanYup'ikZimbabwean
Immigration
NonimmigrantsImmigrantsAfghanistanAfricaAlbaniaArgentinaArmeniaAsiaAustraliaAustriaBahamasBangladeshBarbadosBelarusBelgiumBelizeBoliviaBosnia and HerzegovinaBrazilBulgariaBurma/MyanmarCabo VerdeCambodiaCameroonCanadaCaribbeanCentral AmericaChileChinaColombiaCongoCosta RicaCroatiaCubaCzechoslovakiaDenmarkDominicaDominican RepublicEastern AfricaEastern AsiaEastern EuropeEcuadorEgyptEl SalvadorEnglandEritreaEthiopiaEuropeFijiFranceGermanyGhanaGreeceGrenadaGuatemalaGuyanaHaitiHondurasHong KongHungaryIndiaIndonesiaIranIraqIrelandIsraelItalyJamaicaJapanJordanKazakhstanKenyaKoreaKuwaitLaosLatin AmericaLatviaLebanonLiberiaLithuaniaMalaysiaMexicoMicronesiaMiddle AfricaMoldovaMoroccoNepalNetherlandsNicaraguaNigeriaNorth AmericaNorth MacedoniaNorthern AfricaNorthern EuropeNorwayOceaniaPakistanPanamaPeruPhilippinesPolandPortugalRomaniaRussiaSaudi ArabiaScotlandSenegalSerbiaSierra LeoneSingaporeSomaliaSouth AfricaSouth AmericaSouth Central AsiaSouth Eastern AsiaSouthern EuropeSpainSri LankaSt. Vincent and the GrenadinesSudanSwedenSwitzerlandSyriaTaiwanThailandTrinidad and TobagoTurkeyUgandaUkraineUruguayUzbekistanVenezuelaVietnamWest IndiesWestern AfricaWestern AsiaWestern EuropeYemenZaireZimbabweAzores
Married-couple Households
Income
Poverty
Unemployment
Labor Participation
Family Structure
Vehicle Availability
Education Level
Disability

Married-couple Households Comparison

Romanians

Lumbee

Exceptional
Tragic
48.4%
MARRIED-COUPLE HOUSEHOLDS
98.9/ 100
METRIC RATING
67th/ 347
METRIC RANK
39.6%
MARRIED-COUPLE HOUSEHOLDS
0.0/ 100
METRIC RATING
327th/ 347
METRIC RANK

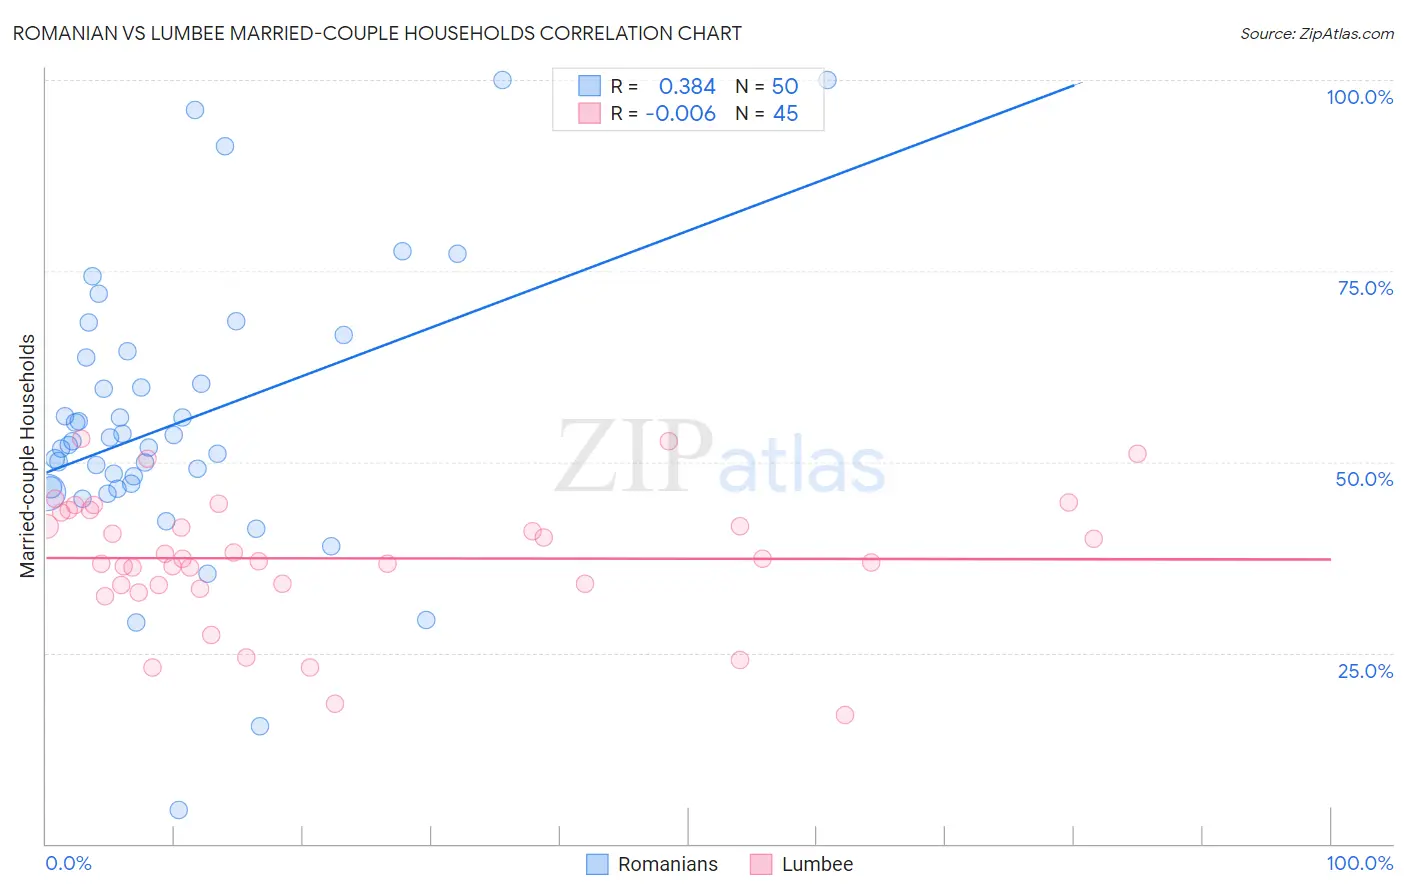
Romanian vs Lumbee Married-couple Households Correlation Chart

The statistical analysis conducted on geographies consisting of 377,697,282 people shows a mild positive correlation between the proportion of Romanians and percentage of married-couple family households in the United States with a correlation coefficient (R) of 0.384 and weighted average of 48.4%. Similarly, the statistical analysis conducted on geographies consisting of 92,264,260 people shows no correlation between the proportion of Lumbee and percentage of married-couple family households in the United States with a correlation coefficient (R) of -0.006 and weighted average of 39.6%, a difference of 22.3%.
Romanian vs Lumbee Married-couple Households

Married-couple Households Correlation Summary

MeasurementRomanianLumbee
Minimum4.5%16.8%
Maximum100.0%53.0%
Range95.5%36.2%
Mean55.1%37.4%
Median52.5%37.3%
Interquartile 25% (IQ1)46.7%33.9%
Interquartile 75% (IQ3)63.6%43.5%
Interquartile Range (IQR)17.0%9.7%
Standard Deviation (Sample)18.4%8.3%
Standard Deviation (Population)18.3%8.2%

Similar Demographics by Married-couple Households

Demographics Similar to Romanians by Married-couple Households

In terms of married-couple households, the demographic groups most similar to Romanians are Jordanian (48.4%, a difference of 0.0%), Immigrants from South Eastern Asia (48.4%, a difference of 0.010%), Immigrants from China (48.4%, a difference of 0.010%), Immigrants from Canada (48.4%, a difference of 0.030%), and Northern European (48.4%, a difference of 0.050%).
DemographicsRating | RankMarried-couple Households
Croatians
99.1
/100
|
#60
Exceptional
48.5%
Bulgarians
99.1
/100
|
#61
Exceptional
48.5%
Luxembourgers
99.1
/100
|
#62
Exceptional
48.5%
Basques
99.0
/100
|
#63
Exceptional
48.4%
Northern Europeans
99.0
/100
|
#64
Exceptional
48.4%
Immigrants | Canada
99.0
/100
|
#65
Exceptional
48.4%
Jordanians
98.9
/100
|
#66
Exceptional
48.4%
Romanians
98.9
/100
|
#67
Exceptional
48.4%
Immigrants | South Eastern Asia
98.9
/100
|
#68
Exceptional
48.4%
Immigrants | China
98.9
/100
|
#69
Exceptional
48.4%
Immigrants | North America
98.9
/100
|
#70
Exceptional
48.4%
Laotians
98.8
/100
|
#71
Exceptional
48.4%
Scotch-Irish
98.6
/100
|
#72
Exceptional
48.3%
Immigrants | Singapore
98.6
/100
|
#73
Exceptional
48.3%
Immigrants | Romania
98.6
/100
|
#74
Exceptional
48.3%

Demographics Similar to Lumbee by Married-couple Households

In terms of married-couple households, the demographic groups most similar to Lumbee are U.S. Virgin Islander (39.8%, a difference of 0.47%), Barbadian (39.4%, a difference of 0.50%), Immigrants from Dominica (39.4%, a difference of 0.57%), Pueblo (40.0%, a difference of 0.93%), and Immigrants from Barbados (39.2%, a difference of 1.0%).
DemographicsRating | RankMarried-couple Households
West Indians
0.0
/100
|
#320
Tragic
40.3%
Immigrants | Liberia
0.0
/100
|
#321
Tragic
40.3%
Immigrants | Zaire
0.0
/100
|
#322
Tragic
40.1%
Puerto Ricans
0.0
/100
|
#323
Tragic
40.1%
Navajo
0.0
/100
|
#324
Tragic
40.1%
Pueblo
0.0
/100
|
#325
Tragic
40.0%
U.S. Virgin Islanders
0.0
/100
|
#326
Tragic
39.8%
Lumbee
0.0
/100
|
#327
Tragic
39.6%
Barbadians
0.0
/100
|
#328
Tragic
39.4%
Immigrants | Dominica
0.0
/100
|
#329
Tragic
39.4%
Immigrants | Barbados
0.0
/100
|
#330
Tragic
39.2%
Immigrants | Congo
0.0
/100
|
#331
Tragic
39.0%
Somalis
0.0
/100
|
#332
Tragic
39.0%
Immigrants | West Indies
0.0
/100
|
#333
Tragic
39.0%
Immigrants | St. Vincent and the Grenadines
0.0
/100
|
#334
Tragic
38.7%