Immigrants from Russia vs Mongolian Married-couple Households
COMPARE
Immigrants from Russia
Mongolian
Married-couple Households
Married-couple Households Comparison
Immigrants from Russia
Mongolians
47.0%
MARRIED-COUPLE HOUSEHOLDS
77.6/ 100
METRIC RATING
150th/ 347
METRIC RANK
46.3%
MARRIED-COUPLE HOUSEHOLDS
42.0/ 100
METRIC RATING
180th/ 347
METRIC RANK
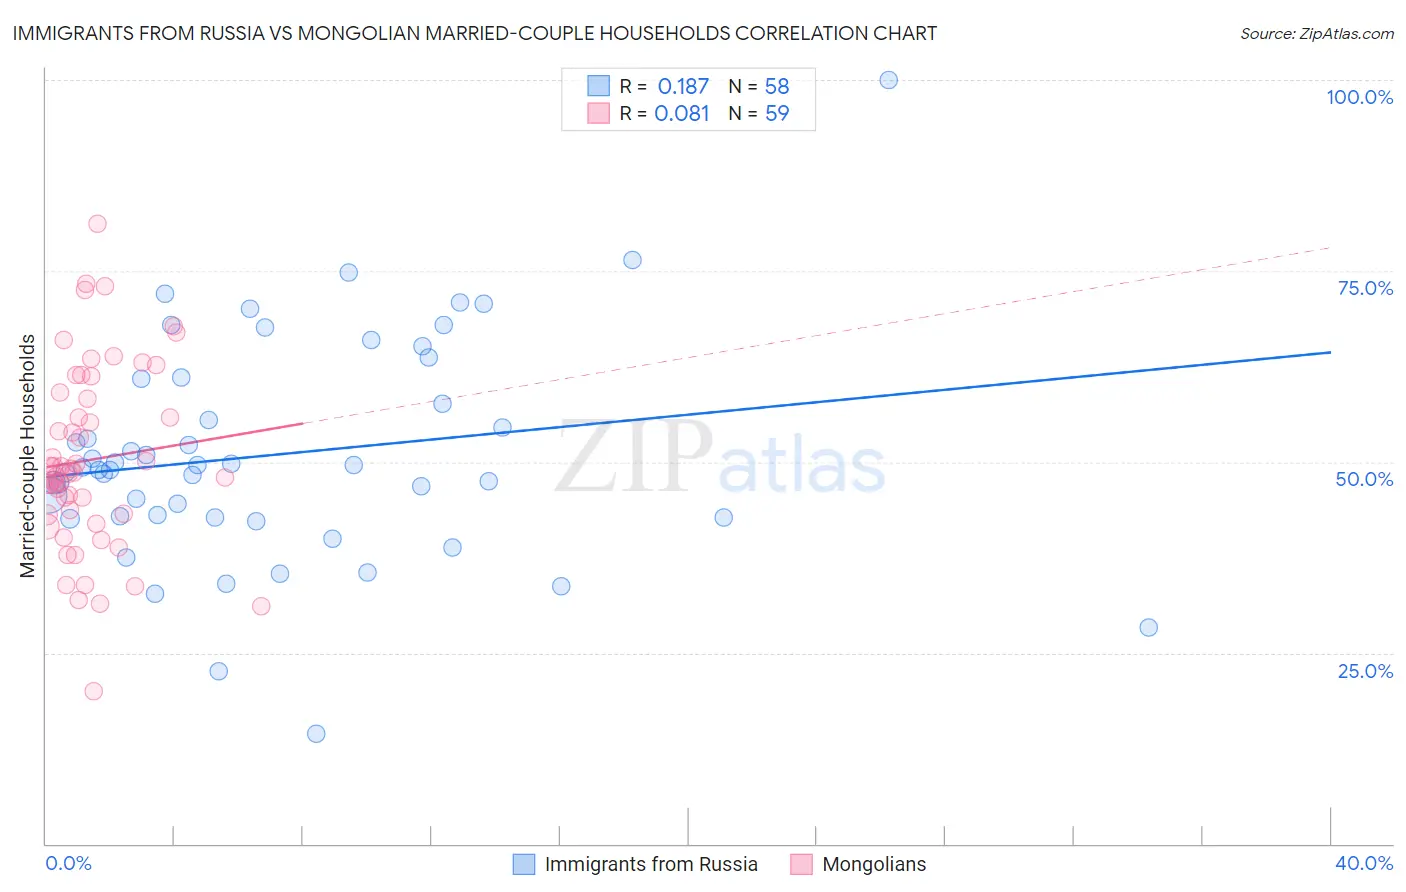
Immigrants from Russia vs Mongolian Married-couple Households Correlation Chart
The statistical analysis conducted on geographies consisting of 347,712,373 people shows a poor positive correlation between the proportion of Immigrants from Russia and percentage of married-couple family households in the United States with a correlation coefficient (R) of 0.187 and weighted average of 47.0%. Similarly, the statistical analysis conducted on geographies consisting of 140,286,033 people shows a slight positive correlation between the proportion of Mongolians and percentage of married-couple family households in the United States with a correlation coefficient (R) of 0.081 and weighted average of 46.3%, a difference of 1.5%.
Married-couple Households Correlation Summary
| Measurement | Immigrants from Russia | Mongolian |
| Minimum | 14.4% | 20.0% |
| Maximum | 100.0% | 81.2% |
| Range | 85.6% | 61.2% |
| Mean | 51.0% | 50.3% |
| Median | 49.1% | 48.6% |
| Interquartile 25% (IQ1) | 42.8% | 43.0% |
| Interquartile 75% (IQ3) | 60.9% | 59.1% |
| Interquartile Range (IQR) | 18.1% | 16.1% |
| Standard Deviation (Sample) | 14.5% | 12.1% |
| Standard Deviation (Population) | 14.4% | 12.0% |
Similar Demographics by Married-couple Households
Demographics Similar to Immigrants from Russia by Married-couple Households
In terms of married-couple households, the demographic groups most similar to Immigrants from Russia are Immigrants from Bulgaria (47.0%, a difference of 0.050%), Paraguayan (47.0%, a difference of 0.060%), Serbian (47.0%, a difference of 0.070%), Hmong (47.0%, a difference of 0.080%), and Immigrants from Western Asia (46.9%, a difference of 0.080%).
| Demographics | Rating | Rank | Married-couple Households |
| Immigrants | Belarus | 83.8 /100 | #143 | Excellent 47.2% |
| Mexicans | 83.4 /100 | #144 | Excellent 47.1% |
| Slovenes | 81.7 /100 | #145 | Excellent 47.1% |
| Immigrants | Western Europe | 81.6 /100 | #146 | Excellent 47.1% |
| Immigrants | Syria | 81.6 /100 | #147 | Excellent 47.1% |
| Icelanders | 79.5 /100 | #148 | Good 47.0% |
| Paraguayans | 78.7 /100 | #149 | Good 47.0% |
| Immigrants | Russia | 77.6 /100 | #150 | Good 47.0% |
| Immigrants | Bulgaria | 76.8 /100 | #151 | Good 47.0% |
| Serbians | 76.3 /100 | #152 | Good 47.0% |
| Hmong | 76.2 /100 | #153 | Good 47.0% |
| Immigrants | Western Asia | 76.1 /100 | #154 | Good 46.9% |
| Arabs | 76.0 /100 | #155 | Good 46.9% |
| Armenians | 75.4 /100 | #156 | Good 46.9% |
| Immigrants | Oceania | 74.8 /100 | #157 | Good 46.9% |
Demographics Similar to Mongolians by Married-couple Households
In terms of married-couple households, the demographic groups most similar to Mongolians are Malaysian (46.3%, a difference of 0.010%), Immigrants from Zimbabwe (46.3%, a difference of 0.040%), Immigrants from Costa Rica (46.3%, a difference of 0.050%), Immigrants (46.3%, a difference of 0.070%), and Cajun (46.4%, a difference of 0.12%).
| Demographics | Rating | Rank | Married-couple Households |
| Immigrants | Norway | 52.0 /100 | #173 | Average 46.5% |
| Immigrants | Mexico | 50.0 /100 | #174 | Average 46.4% |
| Immigrants | Colombia | 46.1 /100 | #175 | Average 46.4% |
| Cajuns | 45.2 /100 | #176 | Average 46.4% |
| Immigrants | Immigrants | 43.8 /100 | #177 | Average 46.3% |
| Immigrants | Costa Rica | 43.4 /100 | #178 | Average 46.3% |
| Immigrants | Zimbabwe | 43.0 /100 | #179 | Average 46.3% |
| Mongolians | 42.0 /100 | #180 | Average 46.3% |
| Malaysians | 41.8 /100 | #181 | Average 46.3% |
| Yugoslavians | 38.9 /100 | #182 | Fair 46.2% |
| Immigrants | Brazil | 38.3 /100 | #183 | Fair 46.2% |
| Immigrants | Switzerland | 36.9 /100 | #184 | Fair 46.2% |
| Brazilians | 35.9 /100 | #185 | Fair 46.2% |
| Albanians | 31.1 /100 | #186 | Fair 46.1% |
| Fijians | 29.2 /100 | #187 | Fair 46.1% |