Immigrants from Russia vs Sioux Married-couple Households
COMPARE
Immigrants from Russia
Sioux
Married-couple Households
Married-couple Households Comparison
Immigrants from Russia
Sioux
47.0%
MARRIED-COUPLE HOUSEHOLDS
77.6/ 100
METRIC RATING
150th/ 347
METRIC RANK
41.5%
MARRIED-COUPLE HOUSEHOLDS
0.0/ 100
METRIC RATING
305th/ 347
METRIC RANK
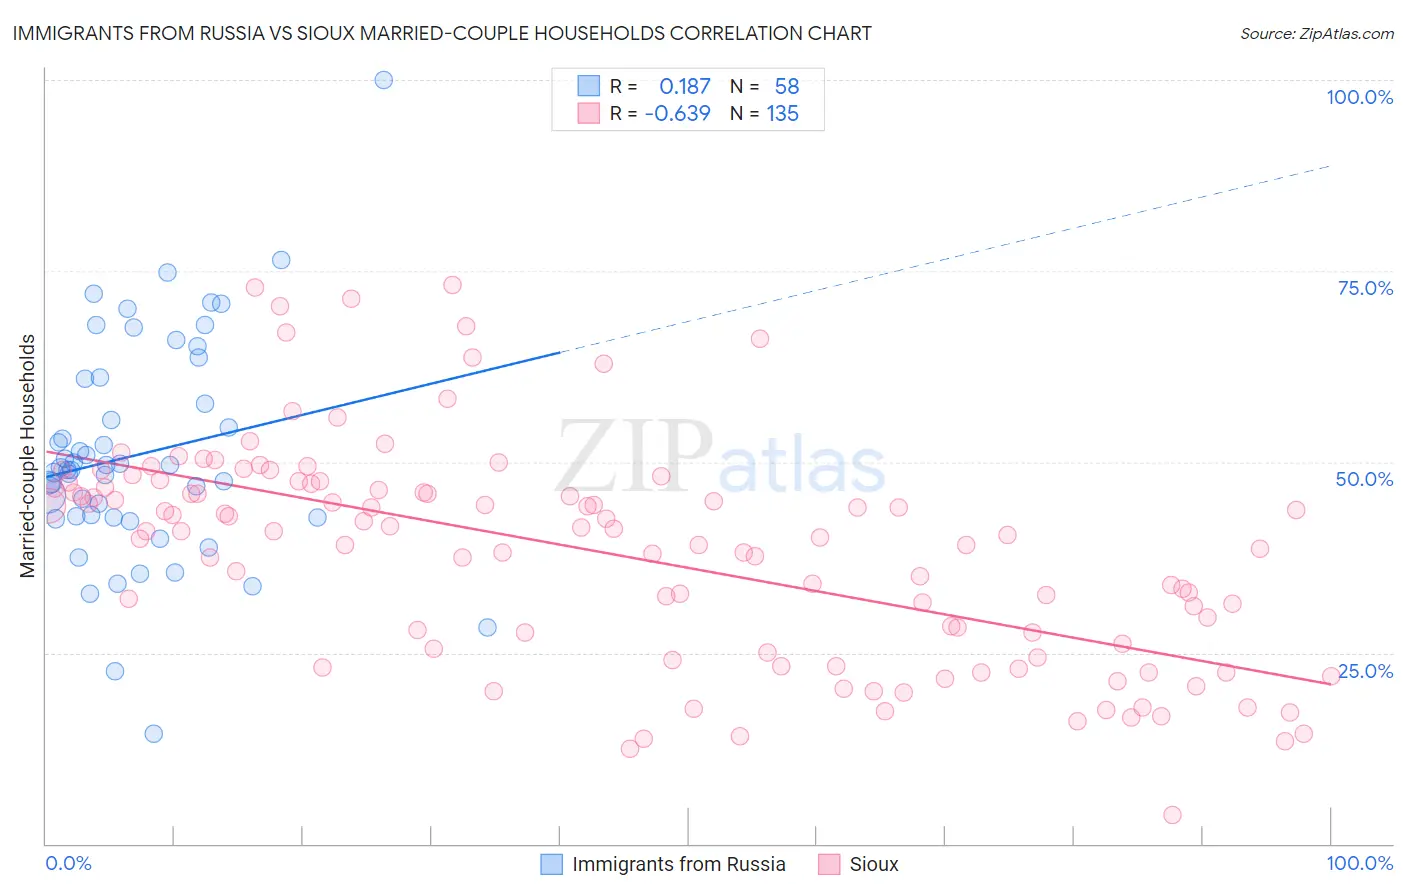
Immigrants from Russia vs Sioux Married-couple Households Correlation Chart
The statistical analysis conducted on geographies consisting of 347,712,373 people shows a poor positive correlation between the proportion of Immigrants from Russia and percentage of married-couple family households in the United States with a correlation coefficient (R) of 0.187 and weighted average of 47.0%. Similarly, the statistical analysis conducted on geographies consisting of 234,109,143 people shows a significant negative correlation between the proportion of Sioux and percentage of married-couple family households in the United States with a correlation coefficient (R) of -0.639 and weighted average of 41.5%, a difference of 13.2%.
Married-couple Households Correlation Summary
| Measurement | Immigrants from Russia | Sioux |
| Minimum | 14.4% | 3.8% |
| Maximum | 100.0% | 73.2% |
| Range | 85.6% | 69.4% |
| Mean | 51.0% | 38.1% |
| Median | 49.1% | 40.9% |
| Interquartile 25% (IQ1) | 42.8% | 25.5% |
| Interquartile 75% (IQ3) | 60.9% | 46.7% |
| Interquartile Range (IQR) | 18.1% | 21.2% |
| Standard Deviation (Sample) | 14.5% | 14.3% |
| Standard Deviation (Population) | 14.4% | 14.3% |
Similar Demographics by Married-couple Households
Demographics Similar to Immigrants from Russia by Married-couple Households
In terms of married-couple households, the demographic groups most similar to Immigrants from Russia are Immigrants from Bulgaria (47.0%, a difference of 0.050%), Paraguayan (47.0%, a difference of 0.060%), Serbian (47.0%, a difference of 0.070%), Hmong (47.0%, a difference of 0.080%), and Immigrants from Western Asia (46.9%, a difference of 0.080%).
| Demographics | Rating | Rank | Married-couple Households |
| Immigrants | Belarus | 83.8 /100 | #143 | Excellent 47.2% |
| Mexicans | 83.4 /100 | #144 | Excellent 47.1% |
| Slovenes | 81.7 /100 | #145 | Excellent 47.1% |
| Immigrants | Western Europe | 81.6 /100 | #146 | Excellent 47.1% |
| Immigrants | Syria | 81.6 /100 | #147 | Excellent 47.1% |
| Icelanders | 79.5 /100 | #148 | Good 47.0% |
| Paraguayans | 78.7 /100 | #149 | Good 47.0% |
| Immigrants | Russia | 77.6 /100 | #150 | Good 47.0% |
| Immigrants | Bulgaria | 76.8 /100 | #151 | Good 47.0% |
| Serbians | 76.3 /100 | #152 | Good 47.0% |
| Hmong | 76.2 /100 | #153 | Good 47.0% |
| Immigrants | Western Asia | 76.1 /100 | #154 | Good 46.9% |
| Arabs | 76.0 /100 | #155 | Good 46.9% |
| Armenians | 75.4 /100 | #156 | Good 46.9% |
| Immigrants | Oceania | 74.8 /100 | #157 | Good 46.9% |
Demographics Similar to Sioux by Married-couple Households
In terms of married-couple households, the demographic groups most similar to Sioux are Immigrants from Guyana (41.6%, a difference of 0.11%), Subsaharan African (41.6%, a difference of 0.22%), Immigrants from Honduras (41.6%, a difference of 0.23%), Guyanese (41.4%, a difference of 0.37%), and Immigrants from Western Africa (41.4%, a difference of 0.38%).
| Demographics | Rating | Rank | Married-couple Households |
| Immigrants | Middle Africa | 0.0 /100 | #298 | Tragic 41.8% |
| Immigrants | Ghana | 0.0 /100 | #299 | Tragic 41.8% |
| Immigrants | Belize | 0.0 /100 | #300 | Tragic 41.8% |
| Immigrants | Bahamas | 0.0 /100 | #301 | Tragic 41.7% |
| Immigrants | Honduras | 0.0 /100 | #302 | Tragic 41.6% |
| Sub-Saharan Africans | 0.0 /100 | #303 | Tragic 41.6% |
| Immigrants | Guyana | 0.0 /100 | #304 | Tragic 41.6% |
| Sioux | 0.0 /100 | #305 | Tragic 41.5% |
| Guyanese | 0.0 /100 | #306 | Tragic 41.4% |
| Immigrants | Western Africa | 0.0 /100 | #307 | Tragic 41.4% |
| Crow | 0.0 /100 | #308 | Tragic 41.4% |
| Immigrants | Trinidad and Tobago | 0.0 /100 | #309 | Tragic 41.2% |
| Haitians | 0.0 /100 | #310 | Tragic 41.2% |
| Colville | 0.0 /100 | #311 | Tragic 41.0% |
| Africans | 0.0 /100 | #312 | Tragic 40.9% |